What Is AI Observability? a Practical Guide for 2026
You shipped the AI feature. The demo worked. Early users were happy. Then production exposed everything your demo skipped.
One customer asks a routine question and gets nonsense. Another gets a refusal for a case your eval set passed last week. Support reports the assistant suddenly sounds longer and less helpful. Finance sees model spend rising faster than traffic. Engineering checks uptime, CPU, and error rate, and the dashboards still look fine.
That is the core production problem. AI systems fail in ways standard monitoring does not capture. A service can stay up while answer quality drops, routing changes, retrieval goes stale, guardrails block good requests, or a fallback model doubles your cost, undetected.
AI observability is the discipline of instrumenting those failure modes so teams can see how an AI request moved through the system. That includes prompts, model and provider selection, retrieval context, tool calls, latency by step, token consumption, safety decisions, and output behavior. The goal is operational control, not nicer logs.
That control plane angle matters. In production, AI observability is not only about debugging bad answers. It is how teams manage spend, decide when to route to a cheaper or stronger model, verify security and policy checks, trace failures across multi-step chains, and explain what happened when a user says, "your AI gave me this."
Basic explainers usually stop at output quality. Production teams cannot. They need visibility into the full request path, because quality, cost, latency, routing, and security are tied together. If you cannot trace all five in one place, you are not observing the system well enough to run it with confidence.
Table of Contents
- Your AI Feature Is Live Now What
- Why AI Demands a New Approach Beyond Monitoring
- The Core Signals of AI Observability
- Practical Metrics and Alerts to Implement
- How to Implement AI Observability A Rollout Checklist
- Common Tooling Approaches Build vs Buy vs Unified Backend
- Putting It All Together A Unified Backend Example
Your AI Feature Is Live Now What
You ship the feature on Friday. By Monday, nothing looks broken in the usual dashboards. Requests are still returning 200s. CPU is fine. Error rate is flat. But support tickets start coming in because the assistant is giving stale answers, the wrong users are hitting the expensive model path, and response times jumped after a retrieval change increased prompt size.
That is the first lesson of production AI. Availability is only one small part of system health.
A live AI feature is a control problem. You need to know what the system saw, which model and prompt version it used, what context was injected, whether a tool was called, what it cost, and whether any policy checks fired. If you cannot answer those questions per request, the feature is running without a real control plane.
The real production problem
The hard part is not detecting that something happened. The hard part is explaining why it happened, deciding whether it is acceptable, and fixing it before cost, latency, or trust gets worse.
In practice, product and engineering teams need answers to questions like these:
- Behavior: Why did this user get this answer, and what inputs shaped it?
- Cost: What changed in the request path that made this workflow more expensive?
- Routing: Which provider, model, and prompt version handled the request?
- Safety: Did the system expose sensitive data, miss a policy violation, or block a valid request?
- Accountability: Was the failure caused by retrieval, prompt construction, model output, tool execution, or application code?
Those are not debugging nice-to-haves. They are operating requirements for any AI feature tied to revenue, support load, or regulated data.
A healthy AI system is one your team can explain, control, and change without guessing.
That is the standard AI observability has to meet. It has to support output quality debugging, but that is only part of the job. In production, the same system also needs to show cost drivers, routing decisions, security events, and policy outcomes. Otherwise, teams end up with three separate problems. Unclear behavior, rising spend, and weak governance.
Why teams are taking it seriously
Teams adopted AI observability because traditional application monitoring stops at the edge of the probabilistic system. It can tell you the service responded. It usually cannot tell you whether the response was grounded, whether the wrong model handled the request, or whether a guardrail changed user experience for one segment and not another.
That gap gets wider as the stack grows. Add retrieval, prompt templates, fallback routing, tool calls, moderation checks, and provider failover, and a single user request turns into a chain of decisions with real business impact. One bad config change can increase cost, slow response time, weaken answer quality, and create a security review issue at the same time.
That is why AI observability belongs in the production control plane. It gives teams the ability to inspect decisions, enforce policies, compare paths, and respond with something better than guesswork.
Why AI Demands a New Approach Beyond Monitoring
Think of traditional monitoring as your car dashboard. You can see fuel level, engine temperature, and whether the battery light is on. That's useful. But if the car starts making a strange noise only when turning uphill after a cold start, the dashboard won't explain it.
AI observability is the mechanic's diagnostic workup. It helps you inspect what happened, under which conditions, and which component influenced the outcome.
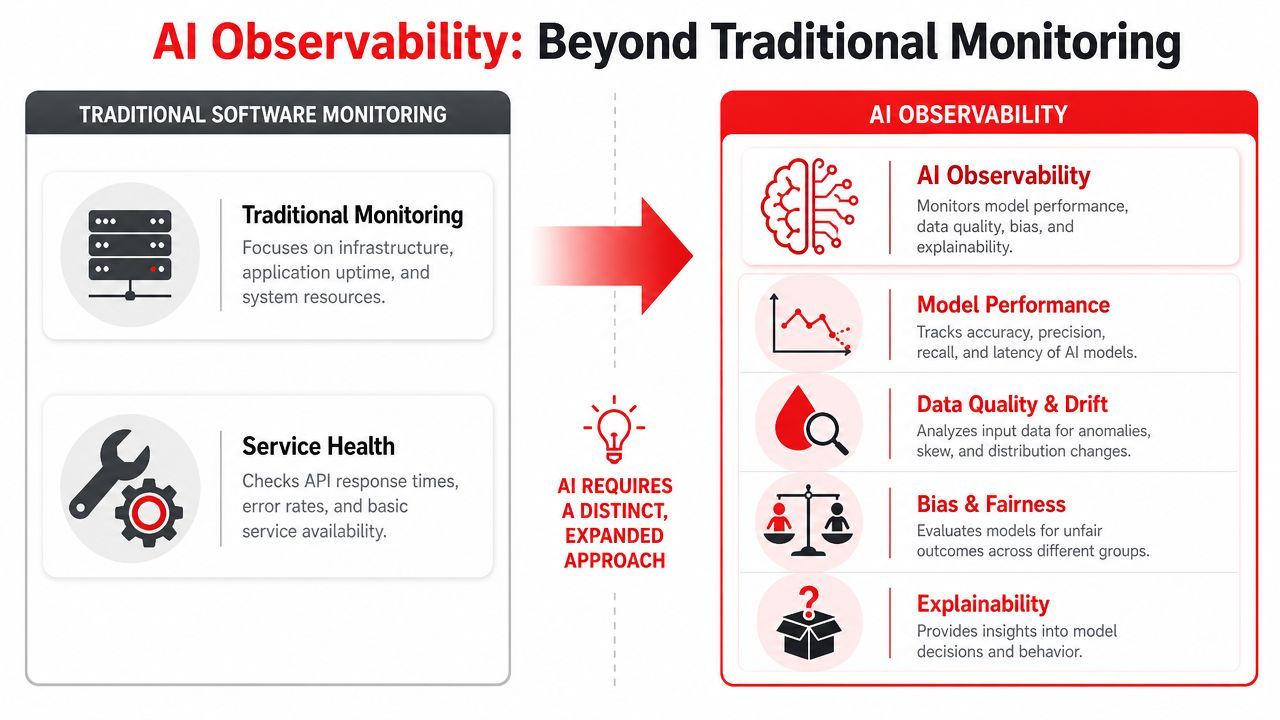
Green dashboards can still hide bad AI
A standard backend dashboard can show healthy infrastructure while users receive low-quality answers. That's because AI failure often isn't binary.
Your API can respond quickly and still be wrong. Your model can produce fluent language and still invent facts. Your orchestration pipeline can complete every step and still choose the wrong tool. None of those are rare edge cases. They're the normal failure modes of probabilistic systems.
This is why organizations moved from static ML monitoring into a broader production discipline for generative AI. IBM notes that teams now need to track performance, quality, cost, and security, with practical metrics including first-token time, end-to-end latency, hallucination rate, token counts, jailbreak success rate, and PII leakage rate in its discussion of observability for generative AI.
AI changes while your service stays up
Classic services mostly fail when code or infrastructure fails. AI systems also fail when behavior shifts.
That shift can come from a prompt edit, a retrieval change, a model version update, a tool contract mismatch, a new user input pattern, or context quality drifting over time. The app can stay online the whole time. Users still get a worse product.
A few practical differences matter:
- Non-determinism: The same input can yield different outputs.
- Long decision chains: A single answer may depend on prompt templates, retrieved context, model routing, memory, and tool calls.
- Opaque quality: Success isn't "request completed." Success is "request completed well enough for the use case."
- New risk surfaces: Security and privacy checks matter at the same layer as latency and cost.
Practical rule: If your incident review ends with "the model was weird," you don't have observability yet.
This is also where many teams stay too narrow. They instrument only the model call. Production AI needs end-to-end visibility across the whole path from input to downstream effect.
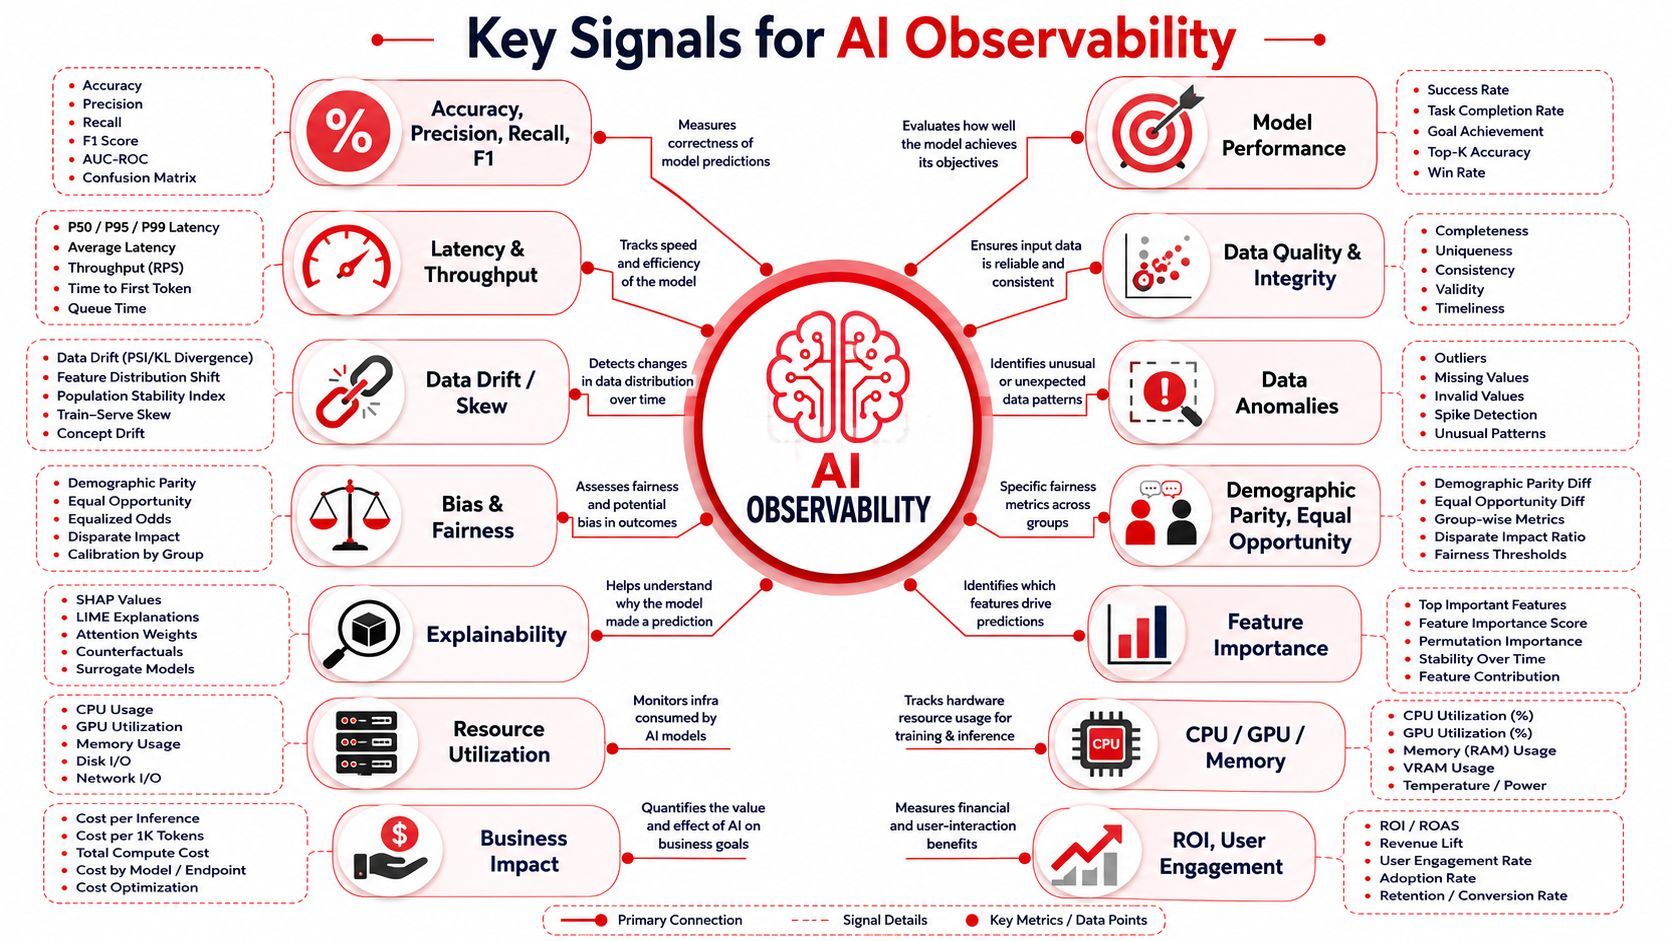
The Core Signals of AI Observability
If you ask what is AI observability in practical terms, the answer is simple: it is the set of signals that let you reconstruct behavior, evaluate quality, control spend, and catch security issues before they become user-visible incidents.
Organizations typically begin with logs, metrics, and traces. That's necessary, but not sufficient.
Start with the full request path
At minimum, every AI request should capture enough context to replay what happened conceptually, even if you redact sensitive payloads.
That means storing or referencing:
- User input and normalized request context: What the user asked, plus relevant metadata.
- Prompt version: The exact prompt template and variables used.
- Model routing decision: Which provider and model served the request, and why.
- Retrieved context: Which documents, memories, or embeddings fed the model.
- Tool activity: Any tool calls, parameters, outputs, retries, and failures.
- Final response and safety decisions: What the user received and what filters or checks ran.
Rubrik emphasizes that AI observability now requires end-to-end system visibility across prompts, routing, tools, and feedback loops, not just output debugging, in its explanation of AI observability.
Later in the workflow, this video is a useful complement to the idea of collecting the right production signals:
The signals that answer real production questions
Different signals answer different kinds of incidents.
The hidden lesson is that AI observability is not just model observability. Once you add agents, multimodal inputs, and tool use, the unit of analysis becomes the system trace, not the single completion.
Feedback and evaluation close the loop
Telemetry alone tells you what happened. It doesn't always tell you whether the result was acceptable.
That's where evaluation and user feedback matter. Thumbs down, task completion failure, policy flags, and reviewer labels help teams connect runtime behavior to product quality. Without that loop, you end up measuring activity, not usefulness.
Bad AI observability tells you the request finished. Good AI observability tells you whether the request was useful, safe, and worth what you paid for it.
For teams building real products, that distinction matters more than almost anything else.
Practical Metrics and Alerts to Implement
Don't start with a giant dashboard full of every metric you can collect. Start with the smallest set that helps your team catch bad behavior quickly and explain it clearly.
The easiest way to do that is to group metrics by operational risk. A common starting point includes three buckets: performance, quality, and cost. Security often cuts across all three, but it deserves its own alerts as soon as you have sensitive data or policy constraints.
Track metrics by operational risk
Performance metrics tell you whether the system feels responsive and where time is spent. For AI systems, that usually means looking beyond request duration and tracking first-token time and end-to-end latency.
Quality metrics tell you whether users are getting acceptable outcomes. This includes model correctness, refusal behavior, structured output validity, hallucination patterns, and explicit feedback.
Cost metrics tell you whether your architecture is sustainable. Token-heavy prompts, bad routing rules, and repeated retries can all turn a working feature into an expensive one.
A simple starting rule works well: alert on sudden change, not just bad absolute values. In AI products, regressions often show up first as drift from baseline behavior.
Key AI observability metrics and alerts
Set alerts around business-critical workflows first. A broken support agent and a broken internal toy feature should not page the team with equal urgency.
What doesn't work is copying metrics from generic app monitoring and calling it done. CPU, memory, and request count still matter. They just don't explain your AI product.
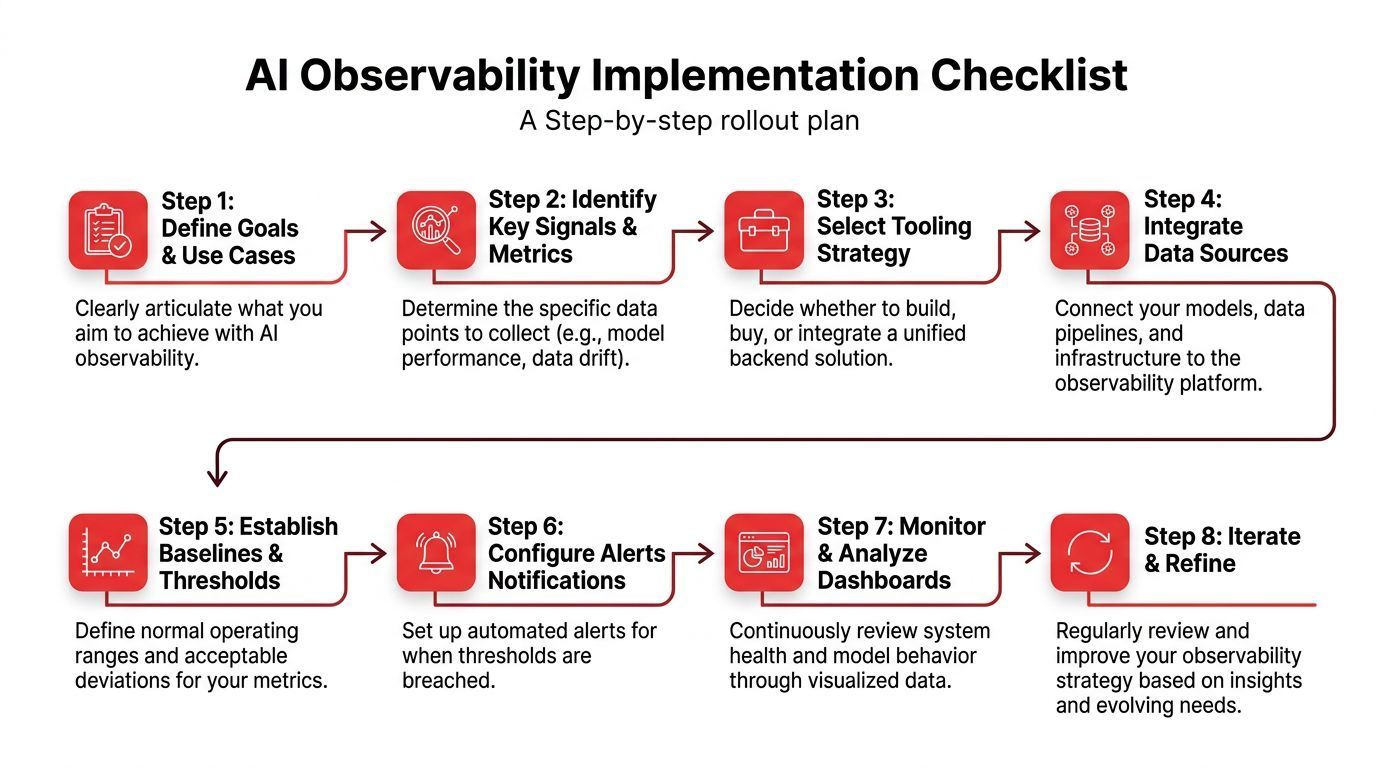
How to Implement AI Observability A Rollout Checklist
A common pitfall is attempting to "add observability later." This typically results in scattered logs, no prompt versioning, no cost visibility, and no way to trace a poor answer back to its origin.
A better approach is to instrument the lifecycle before the incident arrives.
Instrument before you optimize
A practical implementation pattern is to instrument the entire AI lifecycle with telemetry, then use dashboards and alerts to catch drift, hallucinations, and degradation. That pattern also lets teams compare versions, inspect token-level behavior, and isolate whether failures come from the model, data pipeline, or application logic, as described in this guide to implementing AI observability.
A rollout checklist that works in real teams usually looks like this:
- Define critical workflows first. Pick the AI features that affect revenue, trust, or support load.
- Attach a trace ID to every request. One user action should connect all model calls, retrieval steps, and tool executions.
- Version prompts and routing rules. If you can't tell which version ran, you can't debug behavior.
- Capture cost and latency per call. Aggregate later, but log per request.
- Store evaluation outcomes beside runtime data. Quality signals are much more useful when joined to traces.
- Redact or mask sensitive fields. Observability should improve visibility without creating a privacy mess.
- Create alerts for regressions, not only outages. AI often degrades before it breaks.
- Write one runbook per major failure mode. Hallucinations, slow responses, routing mistakes, and tool failures need different playbooks.
Build dashboards for decisions not decoration
A good dashboard answers one role's question clearly.
- Engineers need trace drill-down, latency breakdowns, and failure clustering.
- Product managers need feature-level quality, feedback, and cost trends.
- Operations or support need incident views, not token histograms.
- Compliance and security need policy outcomes, audit trails, and leakage visibility.
If one dashboard tries to serve everyone, it usually serves no one.
Use a consistent debugging flow
When an alert fires, follow the same order every time:
- Check the affected segment: Is this all traffic or one route?
- Compare recent versions: Did prompt, model, or retrieval settings change?
- Inspect the trace: Which step introduced the bad behavior?
- Review evaluation and feedback data: Is the issue quality, safety, or both?
- Rollback or reroute safely: Fix behavior without waiting for a full redeploy if your platform allows it.
Teams get faster when they stop debating where to look first.
That sounds basic, but standardizing the debugging path is what turns observability from a data pile into an operating habit.
Common Tooling Approaches Build vs Buy vs Unified Backend
A lot of teams treat this as a simple procurement decision. It is really an operating model decision.
You can build your own stack, buy a point tool, or run AI behind a unified backend that combines observability with prompt controls, routing, and deployment settings. Those options produce very different outcomes once traffic grows, costs spike, or security asks for an audit trail.
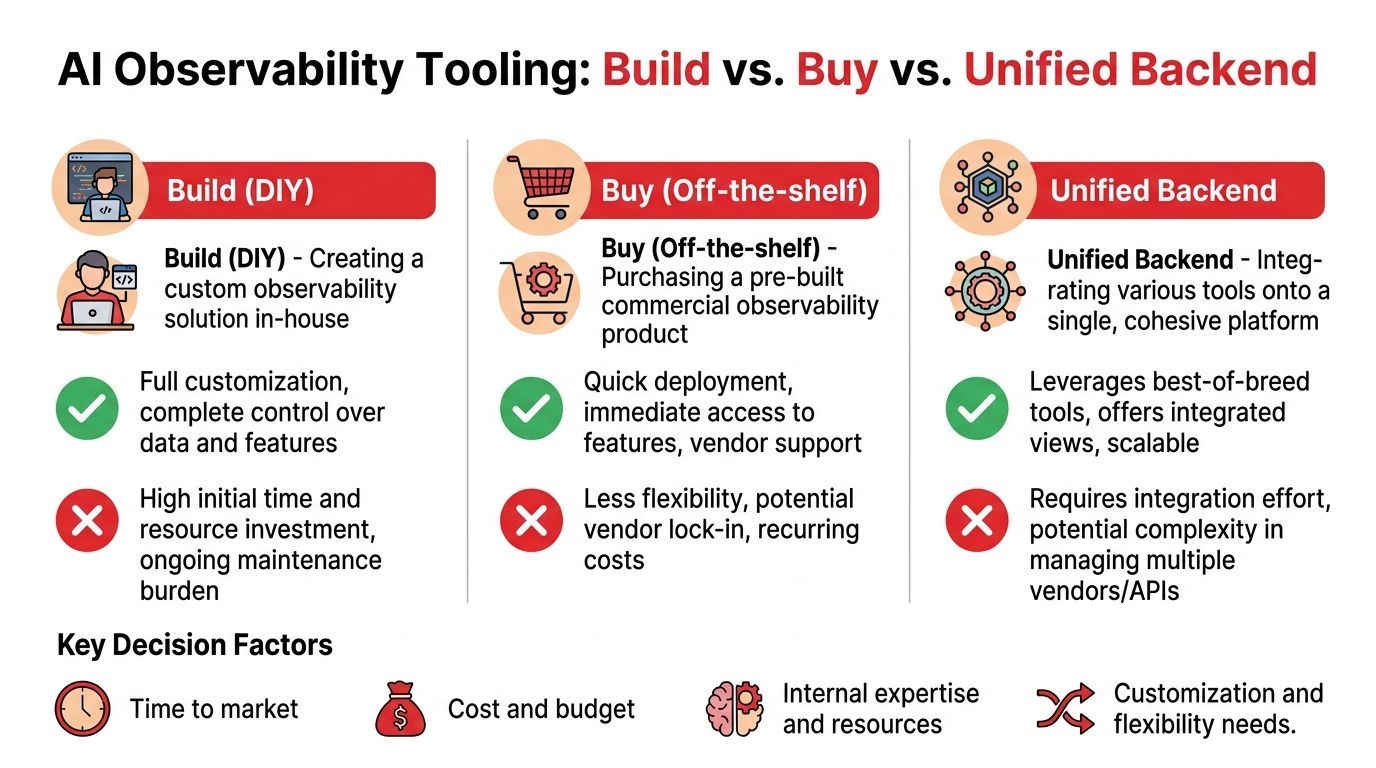
Build gives maximum control and a permanent platform tax
Building in-house makes sense when observability is part of your product advantage, or when data residency, internal governance, or custom agent behavior rules make off-the-shelf tools a bad fit.
The upside is real. You control trace schemas, retention, redaction, access boundaries, and how extensively observability plugs into your application stack. If your team already runs strong platform engineering, that control can be worth the effort.
The cost shows up later.
You are not building a dashboard once. You are signing up to maintain ingestion pipelines, trace propagation across model and tool calls, eval storage, version history, policy logs, cost reporting, and role-based access. Then you have to keep all of that aligned as providers change APIs, models change behavior, and internal teams ask for new controls. A homegrown stack often starts as a debugging project and turns into an internal control plane team.
Buy gives faster coverage and fragmented operations
A point solution usually gets useful data in front of engineers quickly. For a single chatbot or a narrow copiloting feature, that can be the right trade-off.
The problem is fragmentation. Prompt versions often live in one system, provider credentials in another, routing logic in code, and policy checks somewhere else. During an incident, the team still has to reconstruct what happened across multiple tools. That slows down debugging, but the bigger issue is operational. It becomes harder to answer basic production questions such as which model handled a request, why it was routed there, what it cost, whether a policy fired, and who changed the prompt.
That setup is tolerable for early experiments. It gets painful once AI is tied to revenue, support workflows, or regulated data.
Unified backend changes what observability controls
A unified backend addresses that problem by putting observability in the same operational layer as prompt management, model routing, provider settings, and deployment controls.
That matters because production AI needs more than output inspection. Teams need a control plane that can show quality regressions, contain cost drift, enforce routing rules, and preserve security boundaries without sending people across five systems. If observability only explains what the model said after the fact, it is incomplete. In production, the harder questions are often about why the request took a certain path, why it became expensive, or whether it crossed a policy boundary.
IBM makes a similar point in its overview of AI observability as a control plane, with emphasis on auditable controls and governance signals alongside technical telemetry.
Supagen is one example of this unified-backend approach. It combines versioned prompts, multi-provider routing, per-call logs, token and latency tracking, and cost visibility in one backend. That does not remove the need for engineering discipline. It does reduce the number of places your team has to check when behavior changes in production.
The practical choice usually comes down to what pain you expect to own:
- Choose build if observability is a strategic internal platform and you have the team to maintain it.
- Choose buy if you need faster coverage and can accept split workflows across tooling.
- Choose a unified backend if your main problem is operating AI in production across quality, cost, routing, and security from one control surface.
Putting It All Together A Unified Backend Example
A support chatbot starts giving strange, off-brand advice on refund requests. Nothing is obviously broken. The endpoint still works. Error rates look normal. Support tickets rise anyway.
With weak observability, the team starts guessing. Was it the model provider? A bad retrieval index? A subtle prompt bug? A tool timeout? Someone opens three dashboards, checks app logs, and still can't answer the basic question: what changed for the bad requests?
With a unified backend, the debugging path is much shorter.
What the trace shows
The team opens a failing request and sees the full request path in one view:
- the user message
- the active prompt version
- the model route selected for that request
- the retrieved policy snippets
- the tool call used to fetch account status
- token usage and latency
- the final response and safety outcome
One thing stands out fast. A newly published prompt version changed the instruction priority. The bot now overemphasizes empathy language and underemphasizes policy constraints. The retrieval step worked. The tool call succeeded. The model wasn't down. The prompt changed the behavior.
Why this matters operationally
That kind of incident is exactly why AI observability should be treated as a control plane.
The team doesn't need to redeploy the app just to test a theory. They compare the bad prompt version with the prior one, verify that the regression clusters around that change, and roll back the prompt configuration. Then they watch follow-up traces to confirm quality recovers and costs normalize.
The fastest AI incident to fix is the one you can explain in one screen.
This is what AI observability is for. It is for control. Control over quality, routing, spend, safety, and change management. If your team only uses it to inspect bad outputs after users complain, you're using a fraction of its value.
If you're building AI features and don't want prompts, routing, and observability scattered across app code and vendor dashboards, Supagen is worth a look. It gives teams a unified backend to manage prompt versions, model routing, per-call logs, latency, token usage, and costs in one place, which makes production debugging and safer iteration much easier.