
Security Metrics Login: Your Practical Guide for 2026
Your team probably has this problem right now. Support says users “can't log in.” Product says conversion dropped after the new MFA step. Security sees a burst of failed auth events and starts asking whether it's credential stuffing. Engineering checks the auth provider dashboard and gets a pile of generic failures with just enough detail to be noisy and not enough to be useful.
That's the point where login stops being a feature and starts being an observability problem.
In fast-moving AI products, the mess gets worse because not every authentication event comes from a person. Some come from browser sessions. Some come from background workers. Some come from agent workflows calling APIs on a loop. If you lump all of that into one “failed login” chart, you get bad alerts, bad product decisions, and a lot of wasted debugging time. Good security metrics login work starts by treating authentication as a measurable funnel, not a black box.
Table of Contents
- Beyond the Black Box Understanding Your Login Funnel
- The Essential Login Security Metrics You Must Track
- How to Instrument and Measure Login Events
- From Data to Action Setting Thresholds and Alerts
- The Critical Blind Spot Human vs Agent Logins
- Designing Your Login Intelligence Dashboard
- From Monitoring to Strategic Advantage
Beyond the Black Box Understanding Your Login Funnel
A login system usually gets monitored in the least useful possible way. Teams look at uptime, maybe error logs, and maybe a support queue full of “password reset didn't arrive” complaints. That setup guarantees reactive work. You only learn something is broken after users hit it.
The better model is to treat login as a funnel with stages, outcomes, and abandonment points. A user lands on the sign-in form, submits credentials, hits MFA, maybe retries, maybe resets a password, maybe gives up. An agent or service identity follows a different path, but it still produces a sequence you can observe. Once you record those steps as structured events, the auth layer stops being mysterious.
I've seen teams waste hours arguing about whether login issues were caused by policy, bugs, or attacks when the answer was sitting in their telemetry. The problem wasn't lack of logs. It was lack of shape. “Auth failed” is not a metric. It's a shrug.
Practical rule: If support, product, and security all look at the same auth incident and tell different stories, your login data model is too coarse.
A strong login observability setup gives each team a useful view of the same system:
- Product sees friction: Where people abandon the flow and which step adds drag.
- Engineering sees failure modes: Timeouts, invalid state transitions, provider errors, and slow response paths.
- Security sees threat signals: Repeated failures, impossible patterns, and risky access behavior.
That shift matters because login quality directly affects trust. A healthy authentication system should make legitimate access easy and suspicious access visible. When those goals conflict, measurement is the only way to tune the trade-off instead of guessing.
The goal isn't a giant identity analytics program. It's a compact set of signals that answers basic questions fast: who is failing, where are they failing, what changed, and is the traffic human or automated?
The Essential Login Security Metrics You Must Track
A login scorecard only works if it reflects the traffic you have. For modern AI products, that means separating human sign-ins from agent and API authentication from the start. If those flows share one metric table, the numbers look cleaner than the system really is. A spike in expired service tokens can bury a human login UX regression. A burst of consumer login failures can make agent auth look under attack when it is just healthy retry behavior.
Start with four metrics and split each one by identity type. Keep the definitions stable across product, engineering, and security so incident review does not turn into an argument about math.
The anchor metric is Login Success Rate. The formula is simple. Successful authentications divided by total authentication attempts. The hard part is deciding what belongs in the denominator. Count retries wrong, mix staging traffic into production, or combine user and service identities, and the metric stops helping.
What each metric tells you
LSR answers a basic question. Can legitimate actors get in without unusual effort? For human users, a drop usually points to product friction, policy drift, or a bad release around session handling, MFA, or redirects. For agents, a drop usually points to token expiry handling, clock skew, bad secret rotation, SDK regressions, or upstream provider issues. Same metric name. Different failure modes. Treating them as one bucket slows down response.
FLR is your pressure gauge. It does not identify the root cause on its own, but it quickly narrows the search space. A burst of failed human logins from many IPs against a small set of accounts suggests credential stuffing. A burst of failed agent auth from one customer tenant often points to a broken integration or a rotated secret that never propagated. Segment by auth method, app version, entry point, tenant, and identity type or you will miss the pattern that matters.
PRV catches hidden friction before the support queue fills up. This metric belongs to human authentication flows because it reflects memory, device access, enrollment quality, and recovery UX. If password resets or MFA recovery jumps after a policy change, users are paying the cost of that decision. I usually treat reset volume as a product and security metric at the same time. Lowering abuse risk is useful, but not if it inadvertently pushes legitimate users into recovery every week.
A reset spike often means the login policy changed faster than the user experience did.
ADoR shows where intent turns into abandonment. Backend success and failure counts will not expose this on their own because many users quit before the final auth result is written. In practice, high drop-off often comes from MFA enrollment friction, broken redirects, long third-party identity provider round trips, or confusing recovery prompts. This metric applies to human journeys, not headless agent flows, so keep the scope tight.
A small scorecard beats a noisy one. If a metric cannot answer a concrete operational question, cut it. Four clean metrics, each split by human versus agent traffic, will generally give more signal than a dashboard with fifty auth charts nobody trusts.
How to Instrument and Measure Login Events
Log events like product data not syslog noise
Authentication telemetry needs to be structured from day one. If your logs are free-form strings, you'll spend more time cleaning data than learning from it. Treat auth events like analytics events with security fields attached.
Every login-related event should answer a few questions: who initiated it, what step happened, how it ended, which method was used, and whether the actor was human or non-human. That last field matters more now than it did a year ago because AI-heavy products generate lots of automated auth traffic.
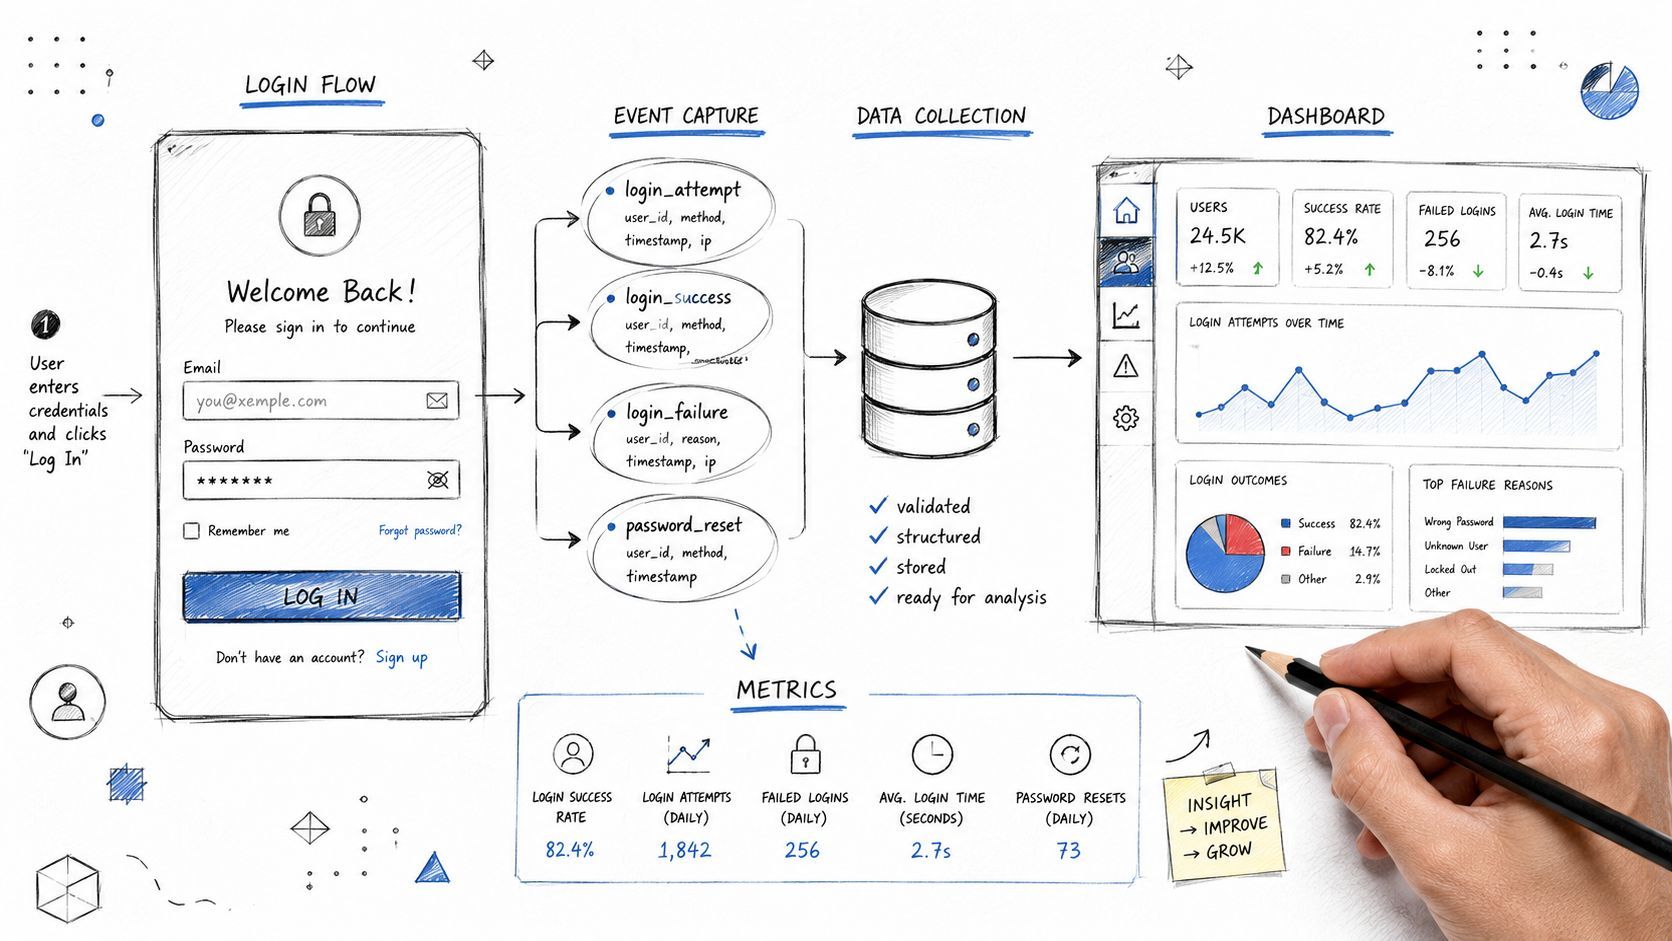
A simple event pipeline works well in most stacks:
- Emit events in the auth service when a step starts, succeeds, fails, or times out.
- Normalize events into JSON before they hit your log sink, queue, or warehouse.
- Enrich events with user, session, device, and identity-type metadata.
- Aggregate daily and near real-time views for dashboards and alerting.
A practical event schema
You don't need a giant schema registry. You need consistent fields.
{
  "timestamp": "2026-01-14T10:15:22Z",
  "event_name": "login.failure.invalid_password",
  "identity_id": "usr_12345",
  "identity_type": "human",
  "session_id": "sess_abc",
  "request_id": "req_789",
  "auth_method": "password",
  "mfa_method": "totp",
  "entry_point": "web_app",
  "result": "failure",
  "failure_reason": "invalid_password",
  "client_app": "dashboard",
  "user_agent_family": "Chrome",
  "geo_region": "us-east",
  "latency_ms": 820
}
For agent traffic, the shape is similar, but fields change slightly:
{
  "timestamp": "2026-01-14T10:15:24Z",
  "event_name": "login.failure.invalid_api_credential",
  "identity_id": "agt_model_router",
  "identity_type": "agent",
  "credential_type": "api_key",
  "entry_point": "internal_api",
  "result": "failure",
  "failure_reason": "rotated_credential",
  "client_app": "workflow_runner",
  "latency_ms": 120
}
The important part is event naming. Don't emit a generic auth.failed. Use names that preserve cause. login.failure.invalid_password, mfa.challenge.abandoned, passkey.assertion.success, and token.exchange.timeout are all far more useful.
Log the failure reason at the point of truth. Don't try to reconstruct it later from five downstream systems.
Turn events into metrics
Once events are structured, the queries are straightforward. Pseudo-SQL is enough to prove the model.
Login Success Rate
SELECT
  DATE(timestamp) AS day,
  SUM(CASE WHEN result = 'success' THEN 1 ELSE 0 END) * 100.0
    / COUNT(*) AS login_success_rate
FROM auth_events
WHERE event_name LIKE 'login.%'
  AND identity_type = 'human'
GROUP BY day
ORDER BY day;
Password Reset Volume
SELECT
  DATE(timestamp) AS day,
  COUNT(*) AS password_resets
FROM auth_events
WHERE event_name IN ('password.reset.requested', 'password.reset.completed')
GROUP BY day
ORDER BY day;
Authentication Drop-Off by Step
SELECT
  funnel_step,
  COUNT(DISTINCT session_id) AS abandoned_sessions
FROM auth_events
WHERE result = 'abandoned'
  AND identity_type = 'human'
GROUP BY funnel_step
ORDER BY abandoned_sessions DESC;
Response Time by Auth Method
SELECT
  auth_method,
  AVG(latency_ms) AS avg_latency_ms
FROM auth_events
WHERE event_name LIKE 'login.%'
GROUP BY auth_method;
Keep one rule in mind. Compute user-facing metrics from human-only traffic unless the metric is explicitly about machine access. That single decision removes a lot of confusion from security metrics login work.
From Data to Action Setting Thresholds and Alerts
Use thresholds for response not reporting
It is 2:13 a.m. Login success rate is still above your weekly average, so the top-line dashboard looks fine. Support is already getting tickets because passkey sign-ins are hanging for one cohort of users in one region. If your alerting only watches aggregate success and failure, you find out too late.
Thresholds should map to an action. Every alert needs an owner, a likely cause, and a first query to run. Otherwise the dashboard turns into incident decoration.
Latency is a good example. Login response time that drifts past an acceptable user wait threshold creates product pain first and security blind spots second. Analysts also track detection speed with metrics such as MTTD, because slow systems and vague alerts both delay response, as noted earlier in SentinelOne's cybersecurity metrics overview. In practice, alert routing should depend on the failure shape, not just the raw number.
- Broad latency increase: check auth provider health, session storage, database reads, and network dependencies.
- Latency isolated to one method: inspect the specific path, such as passkey verification, OTP delivery, SAML redirect, or token exchange.
- Latency paired with failure growth: treat it as a user-facing auth incident and pull in both product and security on-call.
Keep the first version small. A handful of alerts that people trust beats a long list everyone mutes.
Static rules versus dynamic detection
Some conditions deserve hard thresholds because the remediation is clear. Privileged accounts without MFA need a ticket. Dormant privileged accounts need review. In higher-security environments, stale accounts older than the accepted review window are a useful access-control signal, and many teams use a 30 to 60 day window for that check, as noted earlier from the same SentinelOne source.
Behavioral issues are different. A sudden rise in MFA abandonment, retries from a new device pattern, or failed logins clustered by geography usually works better with baselines than fixed lines. The right threshold on Monday morning is often wrong during a product launch, an enterprise rollout, or a mobile app release.
A practical alert stack looks like this:
- Tier 1: User-impacting regressions, such as success-rate drops, reset spikes, and sustained latency by auth method.
- Tier 2: Suspicious activity, such as unusual geography, repeated failures from a new client fingerprint, or concentrated attacks on a small account set.
- Tier 3: Control drift, such as privileged users missing MFA, stale dormant identities, or policy changes that reduce coverage.
One trade-off matters here. Dynamic detection catches subtle attacks earlier, but it also creates tuning work. Static rules are cheap to maintain, but they miss slow shifts and edge-case abuse. Start with static rules for controls and service health. Add anomaly detection only where the baseline moves and the signal justifies the extra noise.
Use MTTD to judge whether the identity pipeline is doing its job. The goal is not more pages. The goal is faster answers about which actor, which method, and which path changed.
The Critical Blind Spot Human vs Agent Logins
Why mixed identity streams create bad security decisions
Most login monitoring breaks in AI products at this stage.
Traditional auth dashboards assume the actor is a person. That assumption worked well enough when most authentication traffic came from browser sessions and employee SSO. It breaks once your product depends on agents, background automations, API-based workflows, and service identities moving between models and tools.
Research from the Non-Human Identity Management Group on login analytics blind spots points out that security teams frequently misidentify benign API agent failures as security threats because they don't segment authentication data by identity type. That leads to noisy alerts and, worse, missed risk because recurring machine-identity failures get treated like human password mistakes instead of rotated or expired credentials.
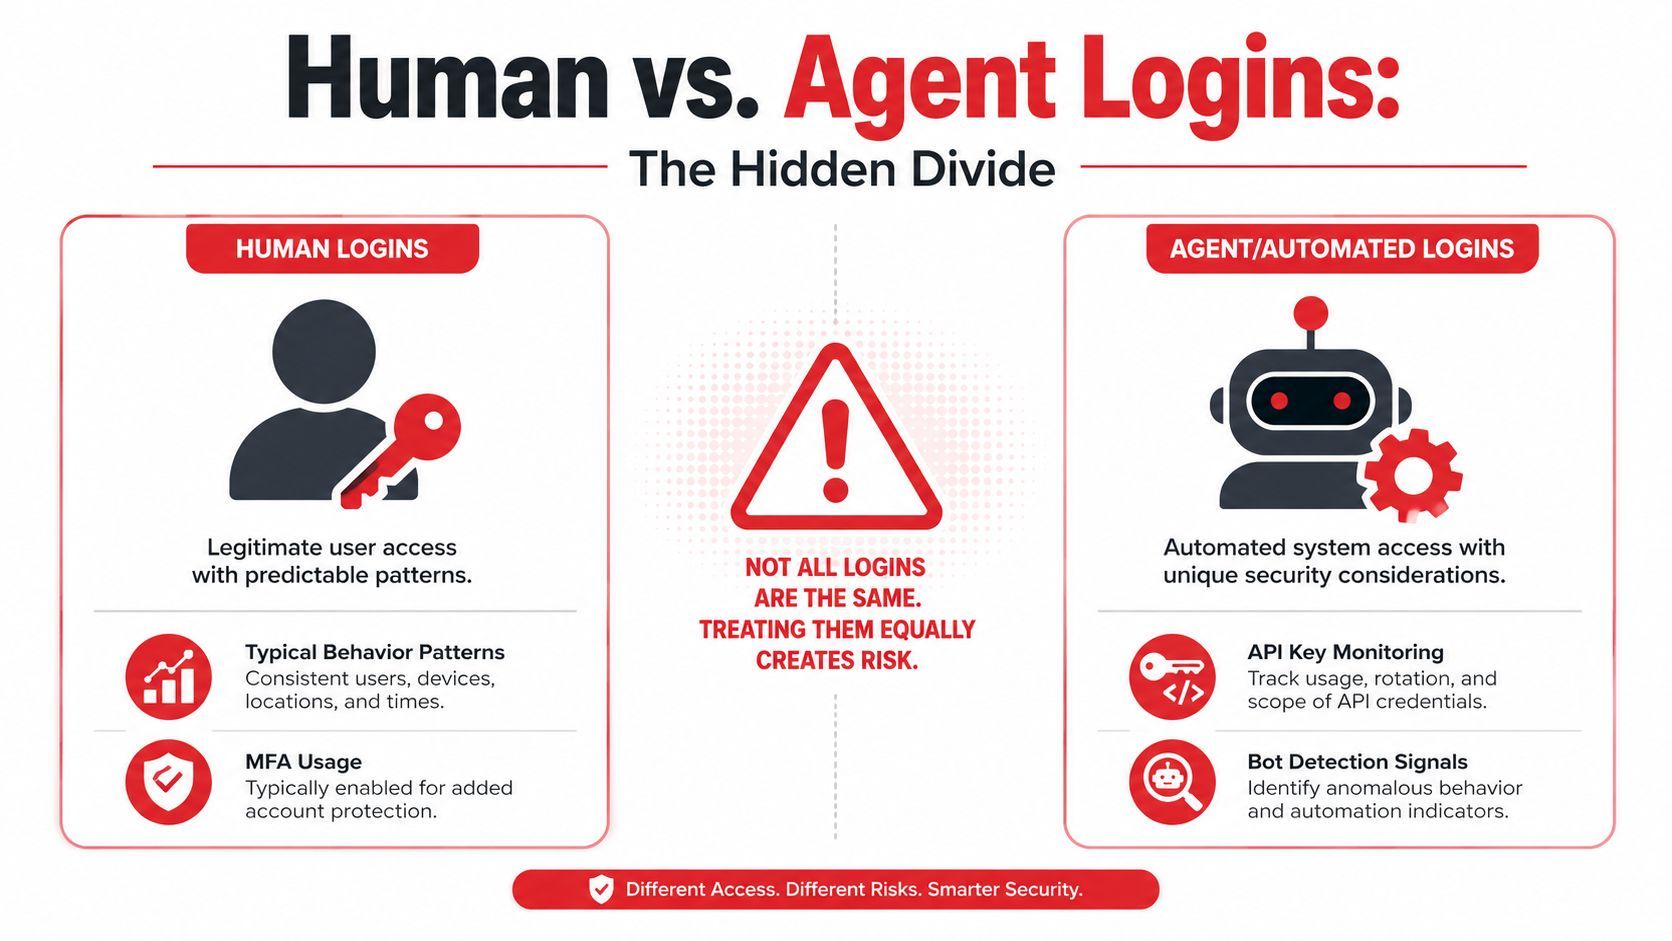
A burst of failures from an agent often has a very different meaning than a burst from a human cohort:
- Human failures may indicate forgotten credentials, MFA friction, phishing follow-through, or a real account attack.
- Agent failures often point to expired secrets, bad rotation timing, revoked access, broken token exchange, or workflow misconfiguration.
If both land in the same chart, on-call engineers can burn an hour chasing a “credential attack” that is really a stale API credential in a background job.
Treating every login event as a user event is one of the fastest ways to make auth analytics useless.
How to segment without rebuilding your auth stack
You don't need a new identity platform to fix this. Add segmentation fields to the events you already emit.
At minimum, tag every auth event with:
- Identity type: human, agent, service, workload, or partner integration.
- Credential type: password, passkey, TOTP, API key, token, OAuth client credentials.
- Execution context: browser, mobile app, backend job, workflow runner, internal service.
- Ownership signal: end user, system process, developer tool, scheduled task.
Then build separate views. Human login metrics should answer questions about friction, abandonment, and account risk. Agent login metrics should answer questions about failure causes, credential hygiene, and workflow continuity.
For machine identities, don't reuse human recovery playbooks. If a recurring failure belongs to an agent, inspect rotation history, secret distribution, and token exchange dependencies first. That's closer to the underlying cause in modern stacks than “user typed the wrong password.”
Designing Your Login Intelligence Dashboard
At 2 a.m., a login spike hits the dashboard right after a model rollout. Product wants to know whether sign-in friction just hurt conversion. Engineering needs to see whether an auth dependency slowed down. Security needs to know whether the spike came from account abuse or from agents retrying a broken token flow. One shared dashboard can support all three, but only if it separates concerns instead of collapsing everything into a single “failed logins” view.
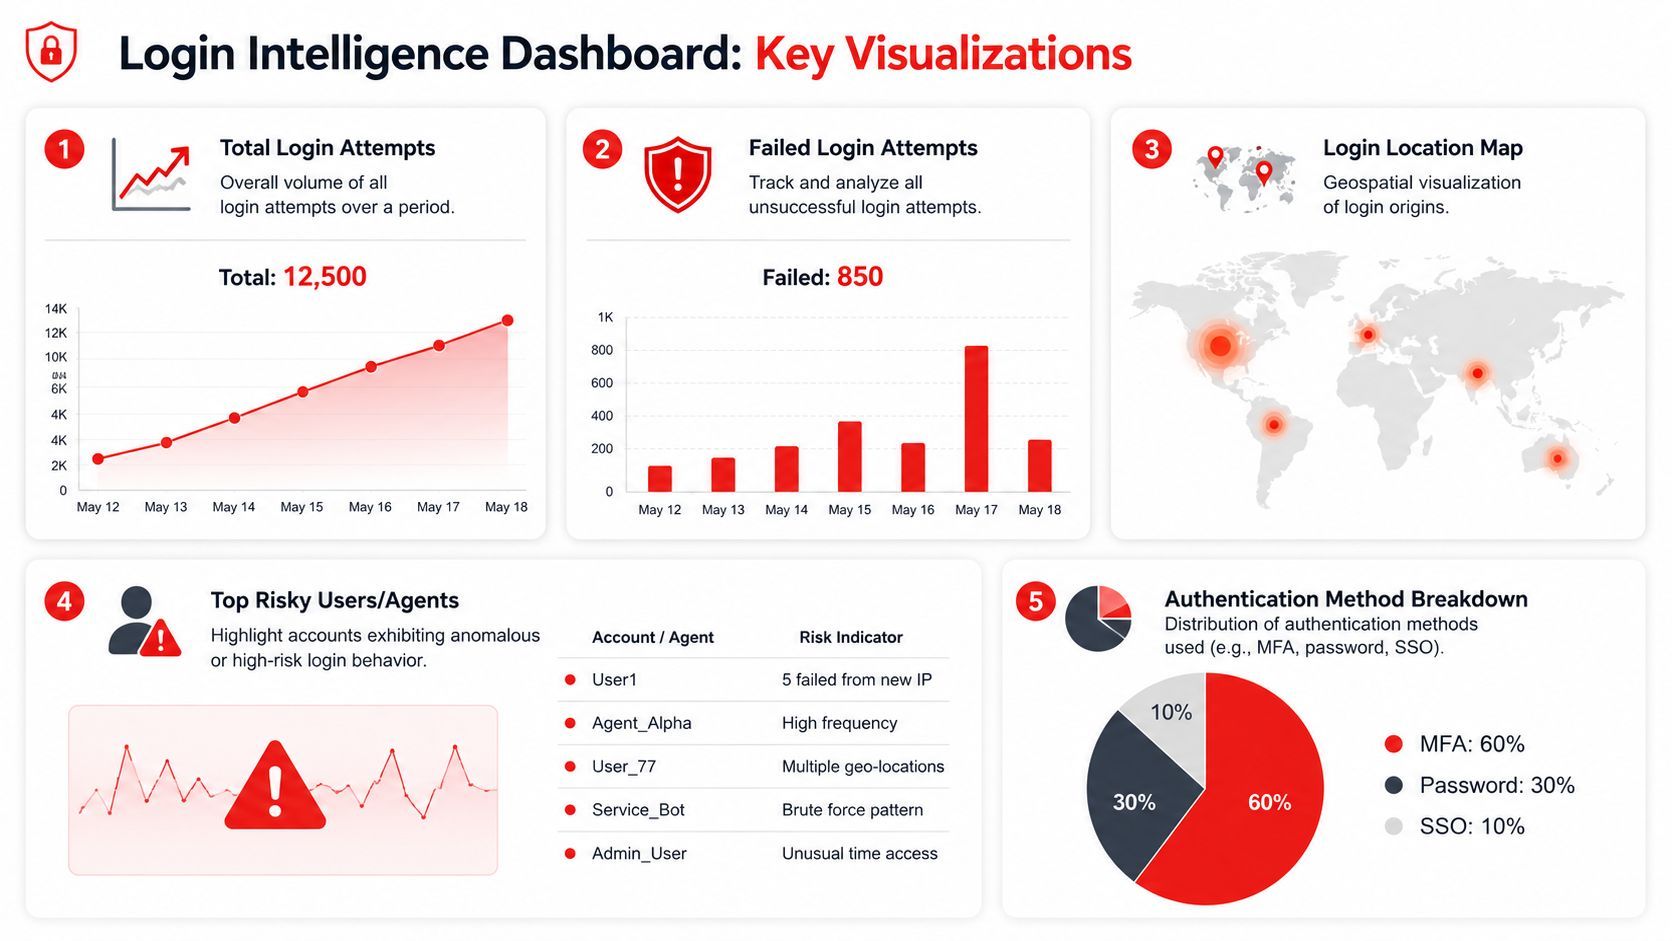
A good dashboard starts with one rule: keep human and agent authentication visible in parallel, not mixed together. AI products blur that boundary fast. A customer signs in from a browser, then an agent calls tools, refreshes tokens, and fans out across background jobs. If those paths share charts without clear segmentation, teams misread both risk and reliability.
What product engineering and security each need to see
For product, the useful view is cohort-based and close to the funnel. Show success rate by new versus returning users, by device class, and by auth method. Put recovery starts beside drop-off points so PMs can tell the difference between true abandonment and a temporary detour through account recovery or MFA.
Engineering needs an operational view that reduces time to root cause. Put latency by method and provider path near failure reasons over time. Keep release markers on the same screen. If passkey completion drops after a frontend change or OAuth callbacks slow down after an infra deploy, engineers should not have to correlate that manually across three tools.
Security needs shape, not just volume. Group suspicious activity by source pattern, geography change, ASN, credential type, and identity type. Split risky users from risky agents into separate widgets. An agent with an expired secret can generate a wall of failures that looks dramatic and means very little from a threat perspective.
This video is a useful reference for thinking about dashboard layout and identity monitoring flow:
Show methods side by side
Method comparison panels are where dashboard design starts paying for itself. Teams make better auth decisions when password, passkey, magic link, OAuth, API key, and client-credential flows sit on the same page with the same definitions for success, latency, and failure.
Passkeys often outperform passwords on completion and support burden, as noted earlier, but the dashboard should still show the trade-off. A passkey rollout can improve human login success while doing nothing for agent auth health. API keys may look stable until rotation week. OAuth may succeed overall while one provider path adds enough latency to hurt mobile conversion. Side-by-side panels make those differences obvious.
Use a layout like this:
Teams should review this dashboard weekly, not only during incidents. That cadence catches slow regressions, keeps auth changes tied to product outcomes, and stops human login issues from getting buried under machine traffic.
From Monitoring to Strategic Advantage
Teams that instrument login well move faster because they stop arguing from anecdotes. Product can ship a new sign-in flow and know whether friction increased. Engineering can isolate whether auth problems came from latency, rollout bugs, or dependency failures. Security can detect suspicious behavior without drowning in false positives from automated systems.
That's the payoff of good security metrics login work. You reduce noise, improve access reliability, and create a cleaner path for decisions about MFA, passkeys, agent identities, and policy changes. The win isn't just fewer incidents. It's higher confidence.
When login data is segmented, structured, and tied to action, authentication stops being a blocker. It becomes a control surface for product velocity and user trust.
If you're building AI features, agents, or multi-step workflows and want better visibility into the systems around them, Supagen gives teams a production layer for prompt management, routing, observability, and cost tracking without hardcoding that logic into the app. It's a practical fit for startups that need to ship quickly while keeping backend behavior auditable.