Logging Level Hierarchy: Master AI Observability in 2026
You're probably here because one of two things is happening.
Either your app is too quiet, and when production breaks you have no idea what happened. Or it's too loud, and every request, branch, retry, and payload is screaming into your logs until the one line that matters gets buried. Both failures lead to the same bad night: a terminal open at 2 AM, a customer waiting, and engineers guessing.
That pain usually starts long before the incident. It starts with print() statements left behind, inconsistent use of info and error, and no shared rule for what deserves a page versus what belongs in a debug session. In small projects, that feels harmless. In real systems, especially AI products with model calls, tool chains, retries, token usage, and cost drift, it turns into operational debt fast.
A good logging level hierarchy fixes that. Not because the names are magical, but because they give every event a clear severity and a clear audience. Developers get enough detail to debug. Operators get signal instead of noise. Finance doesn't get surprised by runaway telemetry and AI usage. And when something goes wrong, your logs tell a story instead of dumping a pile of unrelated text.
Table of Contents
- From Log Chaos to Production Clarity
- What Is the Logging Level Hierarchy
- The Six Standard Logging Levels Unpacked
- When to Use Each Logging Level in Development vs Production
- Practical Logging Code and Configuration Examples
- Logging for AI Agents and Observability Platforms
- Conclusion Building a Culture of Great Logging
From Log Chaos to Production Clarity
A familiar failure mode looks like this: checkout latency climbs, users report broken flows, and the logs are full of lines like “request received” and “processing complete.” No request IDs. No downstream timing. No indication whether the database, cache, queue, or external API failed. You have logs, but they don't answer questions.
The opposite version is just as bad. Someone enabled verbose logging everywhere. Now every handler emits internal state on every call, retries produce duplicate messages, and your log backend is bloated with low-value noise. The important error is there somewhere, but finding it feels like searching a junk drawer for a house key.
That's the point where teams usually realize logging isn't just output. It's a design system.
What bad logging looks like in practice
A weak setup usually has three problems:
- No severity discipline: Developers use
INFO,WARN, andERRORinterchangeably, so alerts lose meaning. - No environment strategy: Local development and production run with roughly the same verbosity, which helps neither.
- No event model: Logs describe code paths, but not operational milestones like job completion, fallback usage, or model cost anomalies.
Good logs answer: what happened, where it happened, how bad it is, and what I should do next.
A proper logging level hierarchy gives you that structure. It turns random output into a severity-based stream that can be filtered, routed, retained, and searched with intent. That's what separates hobby logging from production logging.
Why this matters more now
This gets sharper in distributed apps and AI workloads. A single user action may touch a web service, queue worker, vector store, LLM provider, tool runner, and billing pipeline. If every component logs differently, incident response slows down immediately.
The fix isn't “log more.” It's log with hierarchy. Once the team agrees what belongs at TRACE, DEBUG, INFO, WARN, ERROR, and FATAL, your logs stop being a diary and start becoming an operating tool.
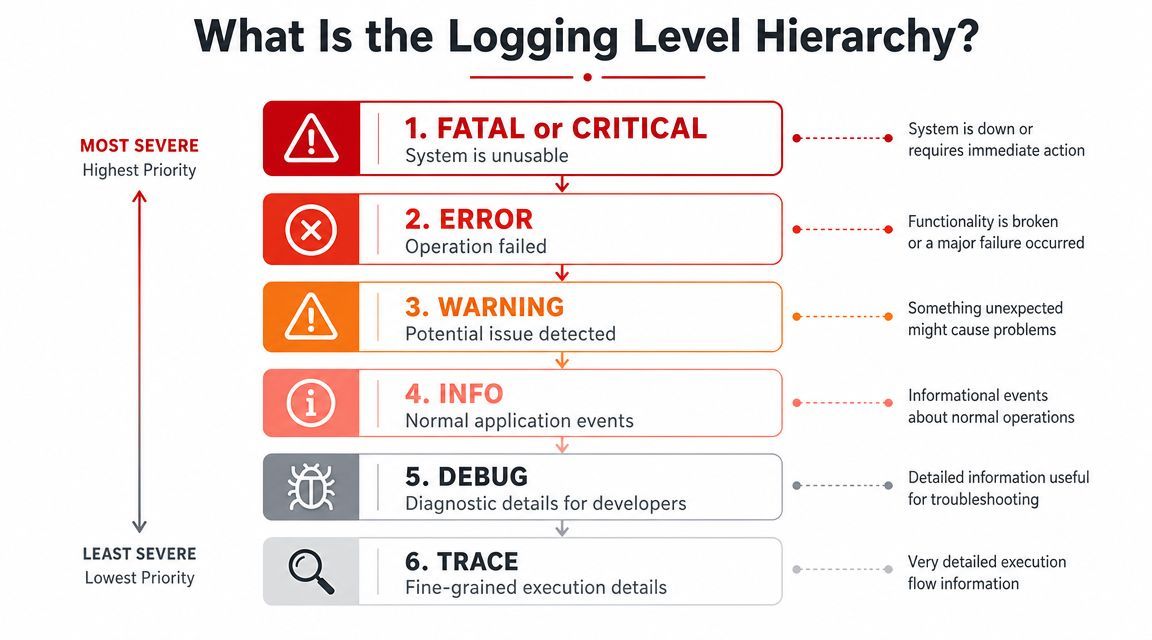
What Is the Logging Level Hierarchy
The logging level hierarchy is the severity order your application uses to label events, from low-value diagnostics to failures that need immediate attention. In most systems, that order is TRACE, DEBUG, INFO, WARN, ERROR, and FATAL or CRITICAL.
A hierarchy matters because logs serve different jobs. Some messages help a developer trace code flow. Others tell an on-call engineer that a payment job failed, an agent exceeded its token budget, or a fallback model took over in production. If those events all land at the same severity, the log stream stops helping. It becomes noise, and noise is expensive.
The ordering gives your team a shared contract:
- TRACE and DEBUG capture fine-grained diagnostic detail for debugging and short-lived investigations.
- INFO records normal events worth keeping, such as service startup, task completion, or an agent finishing a tool call successfully.
- WARN marks abnormal conditions that did not break the request but deserve review, like slow vector queries, retry storms, or prompt truncation.
- ERROR signals a failed operation that affected behavior, such as a provider timeout, parsing failure, or dropped job.
- FATAL or CRITICAL means the process or system cannot continue safely.
What matters most is not the label itself. It is the ordering and the filter behavior behind it.
Set a logger to INFO, and the system keeps INFO, WARN, ERROR, and FATAL while dropping DEBUG and TRACE. That one decision shapes storage cost, search quality, alert volume, and how fast someone can isolate a real incident at 2 AM. In AI and agent systems, that trade-off gets sharper fast. TRACE logs can capture prompt assembly, tool arguments, intermediate reasoning artifacts, and token accounting. Useful during an incident. Painful if left on across every request in production.
That is why good teams treat log levels as an operational policy, not a formatting choice. A WARN should mean roughly the same thing across the API, worker, model gateway, and billing pipeline. Once that consistency is in place, a centralized backend such as Supagen can route high-severity events to alerts, retain lower-severity logs for shorter periods, and let you search one incident across services without guessing which component used ERROR loosely.
Frameworks vary a bit on naming. Python uses CRITICAL where other stacks use FATAL. The principle stays the same. Assign severity based on operational impact, then let your observability tooling handle filtering, retention, and escalation.
The short version is simple. Logging levels help the team decide what deserves attention now, what should be searchable later, and what should never have been shipped to long-term storage in the first place.
The Six Standard Logging Levels Unpacked
At 2 AM, the difference between WARN and ERROR is not academic. It decides whether someone gets paged, how fast they find the failure, and how much junk they have to sift through first. In AI and agent systems, it also decides whether you store expensive low-value traces for every model call, tool hop, and retry loop.
The six levels are simple on paper. The hard part is using them with enough discipline that the labels still mean something months later.
A logger threshold acts as a severity filter. In common frameworks, setting the threshold to WARN drops lower-severity events and keeps the higher ones, as shown in this Log4j explanation of level order, priority, and filtering. That behavior is what makes level choice operational, not cosmetic.
What each level is for
Use these definitions as working rules, then tune them to your system.
- TRACE
Record step-by-step execution detail that you only need during close debugging. Good examples include prompt assembly steps, agent planning transitions, tool argument shaping, parser states, and token accounting for a single request.
Keep TRACE off by default in production. In AI systems, TRACE can explode volume fast and capture data you do not want retained broadly. - DEBUG
Record developer-oriented diagnostics that explain why the code took a path. Good examples include sanitized config values, retry decisions, cache miss reasons, model selection logic, and redacted request or SQL parameters.
DEBUG is useful during active investigation. It is usually too noisy for steady-state production across high-throughput services. - INFO
Record meaningful normal operation. Service startup, job completion, workflow success, provider selected, response returned, document indexed, payment captured.
INFO should give you a clean timeline of what happened without narrating every branch and loop. - WARN
Record abnormal conditions that did not break the user-facing action. A fallback model was used, a tool timed out and a backup succeeded, latency crossed a threshold, a deprecated endpoint was called, or partial data was returned with degradation handled.
WARN should indicate risk or drift. It should not describe routine behavior the system sees all day by design. - ERROR
Record failures where the specific operation did not complete correctly and someone is likely to care. Request handling failed, a write was rejected, an external provider returned a hard failure for this attempt, or an agent could not finish a task after retries.
ERROR is the right level for broken work, not for noise you recovered from cleanly. - FATAL
Record failures that make the process, service, or node unable to continue safely. Required configuration is invalid, a startup dependency is missing, the process is corrupted, or a boot path failed in a way that prevents serving traffic.
Many modern services rarely emit FATAL because orchestrators restart them quickly. That does not make the level useless. It still marks the difference between one bad request and a service that is effectively down.
One test works well in practice. Ask: did the operation succeed, and does a human need to respond now? Those two answers usually narrow the level fast.
For AI and agent workloads, I add a third question. Will logging this event at scale increase storage cost or expose sensitive prompt, tool, or customer data without helping incident response? That question keeps teams from dumping rich execution traces into long-term retention just because the framework made it easy.
Logging level mapping across frameworks
Names vary by ecosystem, but the semantics are close enough to standardize team policy.
Treat that table as a translation guide, not a rulebook. winston, for example, often needs a local convention if you want fatal-style handling to route differently from ordinary errors.
What matters is consistency across services. If your API calls a model gateway, which calls a tool runner, which writes to a queue, WARN should carry the same operational meaning in all four places. That consistency pays off in a centralized backend such as Supagen, where severity drives alerting, retention, search quality, and cost control across both traditional app logs and AI execution logs.
When to Use Each Logging Level in Development vs Production
The same log event can be useful in one environment and wasteful in another. That's why environment-specific defaults matter more than commonly realized.
Production systems are commonly run at INFO or WARN, while development and staging often use DEBUG or TRACE to expose control flow and parameter values for debugging, according to this discussion of environment-specific logging practice.
A sane default for most teams
For most production applications, INFO is the best default.
Why not DEBUG? Because production isn't your notebook. It's a live system with real users, real storage costs, and real operational noise. DEBUG in production tends to produce a lot of low-value chatter, especially in API services, workers, and agent loops.
Why not WARN as the default for everything? Because WARN-only production logs are often too sparse. You lose the normal-operating milestones that help reconstruct what happened before a failure. INFO gives you a timeline. WARN gives you symptoms. You usually need both.
A simple starting policy works well:
- Local development: DEBUG by default. TRACE only when you're chasing something specific.
- Staging: INFO for realism, with selected DEBUG on unstable modules.
- Production: INFO by default. Raise or narrow only with intent.
- High-throughput internals: Component-specific WARN may make sense if INFO is too chatty.
How to turn up verbosity without setting the building on fire
Sometimes you do need DEBUG in production. The mistake is enabling it globally and forgetting to turn it off.
Use a narrow blast radius instead:
- Target one component
Turn on DEBUG for the payment client, model router, or tool executor, not the whole app. - Attach a correlation ID
Make the extra logs useful for one request, one job, or one user journey. - Time-box the change
Treat debug escalation like a temporary patch. Open it, investigate, close it. - Keep secrets out
Verbose modes tend to expose payloads, prompts, and tokens unless you redact aggressively.
Production logging should optimize for signal first, then depth on demand.
What doesn't work is a permanent “just in case” DEBUG policy. Teams think they're buying safety. They usually buy bigger bills and harder searches. Good production logging is selective. You want enough context to diagnose failures, not a transcript of every branch the code took all day.
For AI systems, this distinction matters even more. One agent run can produce multiple model calls, tool invocations, retries, and intermediate states. If you dump all of that at debug level continuously, your observability backend becomes expensive and hard to use. Better to log key milestones at INFO, suspicious-but-successful paths at WARN, and failed steps at ERROR, then reserve DEBUG for targeted investigations.
Practical Logging Code and Configuration Examples
Theory helps. Copyable patterns help more.
The reason modern frameworks feel consistent is historical. The idea of severity-ordered logging traces back to Syslog, which formalized 8 severity levels from Emergency (0) to Debug (7) and created a portable baseline that later frameworks adapted, as described in this Syslog severity overview.
A short walkthrough helps before the code:
Python example
Python's built-in logging module provides the core levels commonly needed.
import logging

logging.basicConfig(
    level=logging.INFO,
    format="%(asctime)s %(levelname)s %(name)s %(message)s"
)

logger = logging.getLogger("order-service")

logger.debug("Loaded discount rules for region=us")
logger.info("Order submitted", extra={"order_id": "ord_123"})
logger.warning("Fallback shipping quote used", extra={"order_id": "ord_123"})
logger.error("Payment authorization failed", extra={"order_id": "ord_123"})
logger.critical("Primary database unavailable during startup")
The important line is level=logging.INFO. That's your filter. DEBUG stays silent until you lower the threshold.
A practical refinement is to set the root logger to INFO, then raise one noisy module temporarily:
db_logger = logging.getLogger("order-service.db")
db_logger.setLevel(logging.DEBUG)
That pattern is much safer than turning on DEBUG globally.
Nodejs with winston
In Node.js, winston is a common choice because configuration is straightforward and transport support is solid.
const winston = require('winston');

const logger = winston.createLogger({
  level: 'info',
  format: winston.format.json(),
  transports: [
    new winston.transports.Console()
  ]
});

logger.debug('Prompt template selected');
logger.info('Chat response delivered', { requestId: 'req_123' });
logger.warn('Model fallback activated', { requestId: 'req_123' });
logger.error('Tool call failed', { requestId: 'req_123' });
Two habits make this production-ready fast:
- Prefer structured fields: Put identifiers in metadata, not inside free-form strings.
- Keep level changes externalized: Read the minimum level from environment or config so you can adjust behavior without code edits.
If your team uses multiple languages, keep the message style and level semantics aligned even when the libraries differ. That consistency matters more than which package you picked.
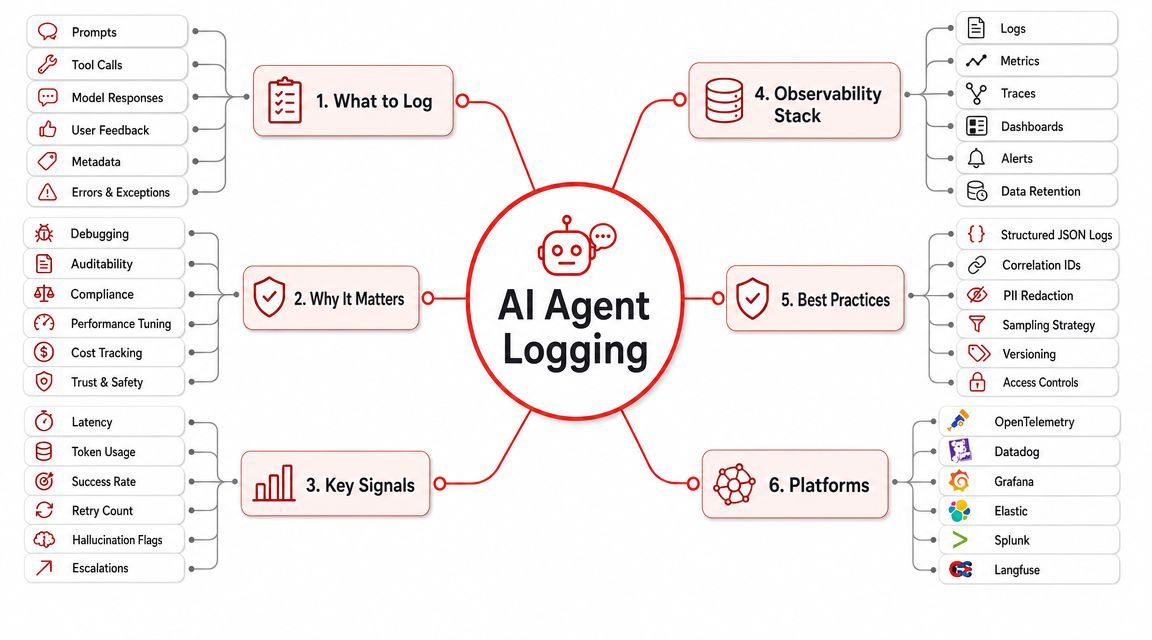
Logging for AI Agents and Observability Platforms
Traditional logging guidance was built around web apps, workers, and infrastructure failures. AI systems add a different class of problem. A request can succeed technically while still being slow, expensive, low quality, or operationally risky.
That's the gap. For AI and LLM applications, the standard hierarchy is often too blunt, and common guides don't answer whether a technically successful but low-quality or expensive output should be INFO or WARN, as noted in Log4j guidance on custom log levels and categorization.
Why AI systems break the old mental model
In a CRUD app, success and failure are usually easier to classify. The database write worked or it didn't. The API call returned what you needed or it failed.
In an AI product, you also care about:
- Quality drift: The model answered, but the answer was weak, off-format, or likely hallucinated.
- Cost anomalies: The request completed, but token usage or provider choice made it much more expensive than expected.
- Latency spikes: The user got a response, but too slowly for the workflow.
- Tool-call instability: The model response succeeded, but the agent used a broken tool path before recovering.
- Prompt regression: A prompt version changed behavior without producing hard failures.
Those aren't imaginary edge cases. They're normal operational concerns in agent systems.
A successful response can still be a warning-worthy event.
A practical convention for AI logging
You don't need a brand-new hierarchy to handle this. You need sharper conventions.
A practical model looks like this:
This approach gives AI teams something generic logging guides often skip: a way to classify quality, latency, and cost without pretending every issue is a crash.
A few implementation habits make this much better:
- Log model metadata at INFO: provider, model name, prompt version, route selected.
- Log cost-related surprises at WARN: especially when the request succeeded but broke your operational expectations.
- Log tool failures at ERROR when user work stops: if the agent can't complete the task, that's not just a warning.
- Attach request and conversation identifiers everywhere: agent debugging without correlation is miserable.
Centralized observability matters here because AI logs are multi-dimensional. You're not just reading text messages. You're looking at per-call tokens, latency, inputs, outputs, tool steps, and spend patterns together. That's why AI teams do better when logs, execution traces, and request metadata land in one backend instead of being split across ad hoc dashboards and provider consoles.
Conclusion Building a Culture of Great Logging
A strong logging level hierarchy isn't about memorizing six labels. It's about making events predictable across the team. When everyone agrees what belongs at INFO, WARN, ERROR, and FATAL, the logs become useful under pressure.
That discipline pays off twice. First, debugging gets faster because the trail is cleaner. Second, operations get cheaper because you stop shipping huge volumes of low-value noise into your log pipeline. Both matter when your app grows from a side project into a service people rely on.
For AI products, the bar is higher. You're not only tracking hard failures. You're tracking output quality, latency, tool reliability, and cost. That means the old “worked or failed” logging mindset isn't enough. Teams need conventions that reflect how modern agent systems misbehave.
Treat logging as a shared engineering practice, not a personal style choice. Review it in pull requests. Keep level meanings consistent across services. Make production defaults conservative, then turn up detail with purpose.
If you're building AI features or agents and want one place to manage prompts, model routing, per-call logs, tokens, latency, inputs, outputs, and cost, Supagen is a practical next step. It gives teams a unified AI backend so you can debug faster, control spend, and improve observability without hardcoding every prompt and model decision into the app.