
LLM Observability: Track & Ship AI Confidently
Your LLM feature passed every demo. The prompt looked solid, the outputs felt sharp, and the happy path worked in staging. Then production happened.
Users started seeing weird answers that nobody on the team could reproduce. Costs climbed without an obvious traffic spike. Some requests got slower, but not all of them. A retrieval flow that looked fine in local testing began returning answers that were technically fluent and completely wrong. The app wasn't crashing. It was failing unannounced.
That's the dangerous part of LLM systems. They often fail without throwing a clean error. You don't get a simple stack trace that says what broke. You get a plausible response, a confused user, and a debugging session built on guesswork.
Table of Contents
- When Good Prompts Go Bad in Production
- What Is LLM Observability Really
- The Core Metrics You Must Track
- Logging and Tracing Patterns for LLM Apps
- Building Your Observability Stack
- From Data to Decisions with Dashboards and Alerting
- Common Pitfalls and Your Starter Checklist
When Good Prompts Go Bad in Production
A lot of teams hit the same wall. They build a chatbot, a support copilot, a content workflow, or a retrieval app. In development, the model behaves well because the team is testing with familiar prompts, clean data, and a small number of predictable flows.
Production changes the shape of the problem.
Users paste messy inputs. Retrieval returns borderline context. Tool calls happen in odd orders. A prompt tweak that improved one use case makes another one worse. The model still returns text, so nothing looks “down,” but the feature stops being trustworthy.
Traditional monitoring misses the real failure
If you only track CPU, memory, request errors, and average latency, you'll miss the part that matters. Your infrastructure can look healthy while your LLM app gives irrelevant answers, violates a JSON schema, ignores retrieved context, or burns tokens on a loop inside an agent.
That's why LLM observability matters. It's not a fancier log viewer. It's the practice of collecting enough context to explain model behavior in production.
Practical rule: If your team can see that a request was slow but can't see the prompt, retrieved context, tool path, model output, and validation result, you don't have enough observability to debug an LLM app.
The painful cases are rarely dramatic outages. They're smaller and more expensive:
- A routing bug sends a class of requests to the wrong model.
- A retrieval issue gives the model stale or low-quality context.
- A prompt edit increases verbosity, which raises token usage and latency.
- A schema failure causes downstream code to retry or discard responses.
- An agent workflow chooses the wrong tool, then recovers badly.
Silent failure is the default unless you instrument for it
Classic software breaks loudly. LLM applications often break politely.
That changes how you operate them. You need visibility into the full request path, not just the API boundary. You need to know what the user asked, what context the system assembled, what the model saw, what it returned, and how the app judged that result.
Without that, debugging turns into team folklore. One person says it's a prompt problem. Another blames the model vendor. Someone else thinks retrieval is slow. Nobody can prove it.
Observability is the x-ray. It lets you stop guessing.
What Is LLM Observability Really
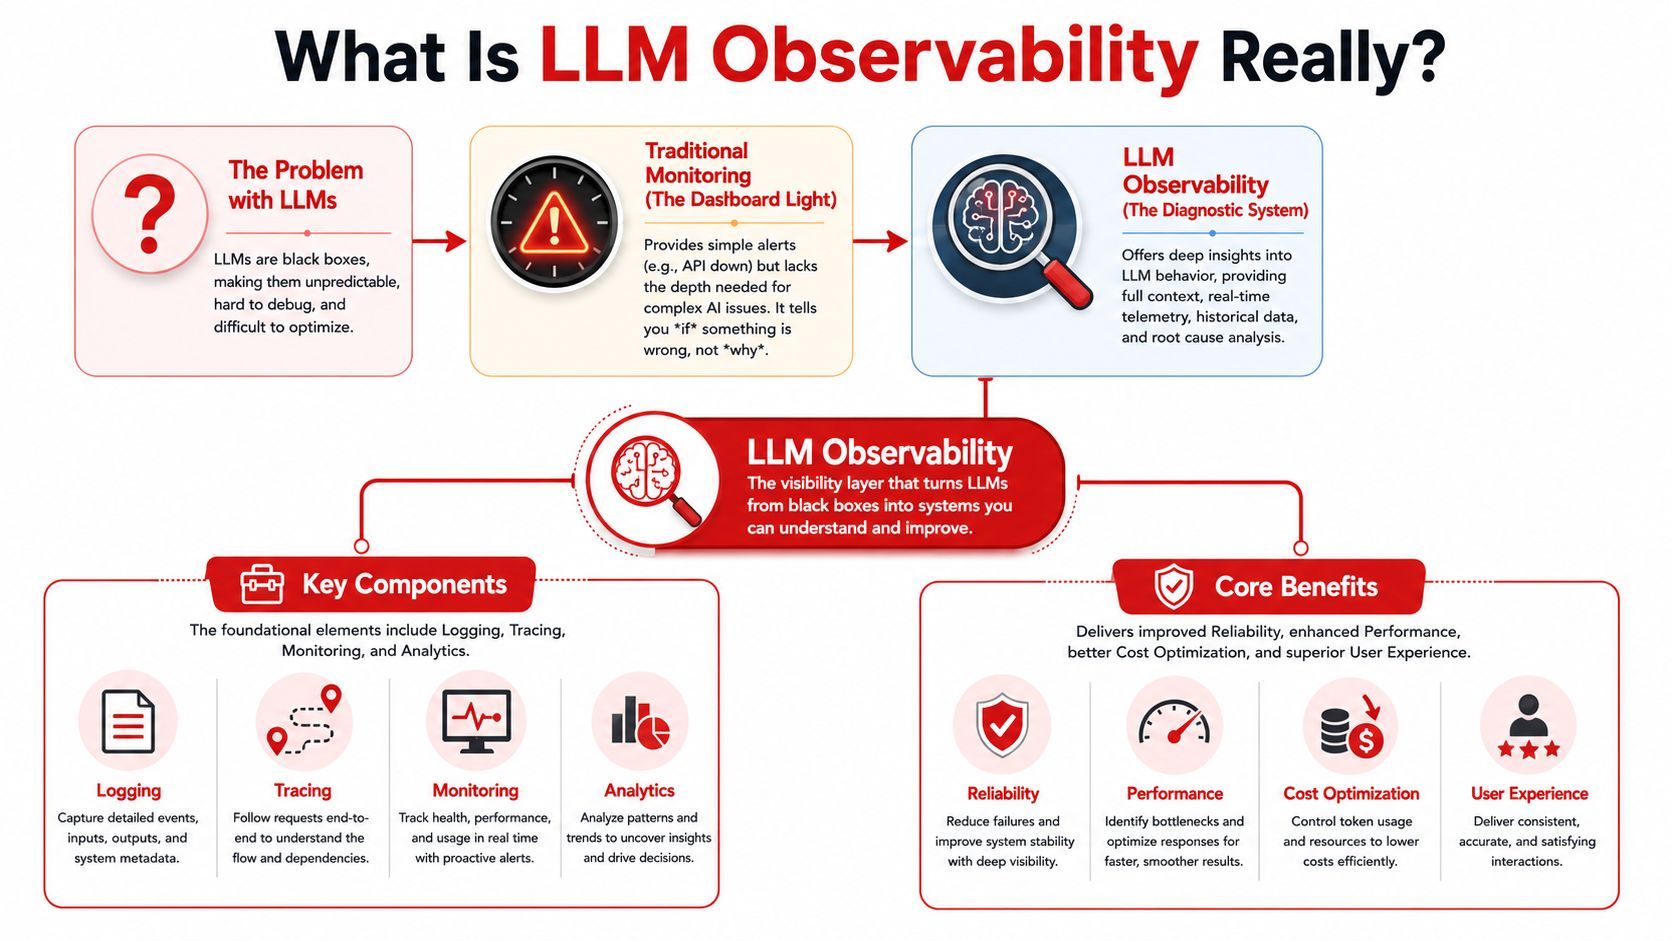
A user report says, “the answer looked confident, but it was wrong.” Your API metrics look normal. Latency is acceptable. Error rate is flat. Cost is a little higher than usual, but not enough to trigger an alert.
That is the gap LLM observability has to close.
Monitoring shows symptoms
Basic monitoring answers a narrow set of questions. Is the endpoint up? Did latency spike? Did the provider return errors? Did token usage jump after a prompt change?
You still need all of that. I rely on it to catch outages, rate-limit problems, and sudden cost regressions.
But LLM failures rarely stay inside infrastructure metrics. A request can complete successfully and still be a production bug. The model may have used the wrong retrieved context, selected the wrong tool, ignored an instruction, or produced output that passed syntax checks and failed the actual task. Traditional dashboards usually flatten those cases into “request succeeded.”
That is why teams get stuck. They can see that something drifted, but they cannot isolate whether the cause was retrieval quality, prompt construction, model behavior, guardrail logic, or application code wrapped around the model call.
Observability explains the failure path
LLM observability means instrumenting the full execution path so one bad answer is traceable from user input to business outcome.
In practice, that means tying operational signals to semantic ones. A slow response matters differently if it came from a larger context window that improved answer quality. A cost increase matters differently if it came from retries caused by schema failures. A hallucination spike matters differently if it started after a retrieval index update rather than a model switch.
That connection is the whole point. You are not only asking, “was this call expensive?” You are asking, “what changed, and did quality improve or get worse because of it?”
A useful trace usually includes these layers:
This structure matters because root cause usually sits between layers. A support bot might get slower because retrieval started returning more documents. That same change might also improve relevance for one segment and increase hallucinations for another because low-quality context now crowds out better sources. If you only track latency and tokens, you miss the reason. If you only review outputs, you miss the operational trigger.
Good observability is queryable, not just stored
A pile of logs is not enough.
The logs need consistent request IDs, trace IDs, version metadata, and structured fields that let you filter by model, prompt template, customer tier, tool path, or failure mode. Otherwise, incident review turns into scrolling through raw payloads and arguing from anecdotes.
The standard I recommend is simple. For any bad response, an engineer should be able to answer four questions quickly: what the user asked, what context the system assembled, what the model produced, and how the application evaluated that result.
If your stack can do that, you have observability. If it can only show that requests got slower or more expensive, you still have monitoring with extra logs.
The Core Metrics You Must Track
Organizations often start with latency and token counts. That's fine for week one. It's not enough for production.
Honeycomb's guidance is the right mental model: effective LLM observability requires a multi-dimensional telemetry strategy that captures latency, token usage, high-cardinality contextual metadata, and semantic quality signals. Without semantic metrics next to system metrics, teams can't separate ordinary performance issues from model drift or hallucination spikes, which makes root-cause analysis weak and slow, as described in Honeycomb's explanation of multi-dimensional LLM telemetry.
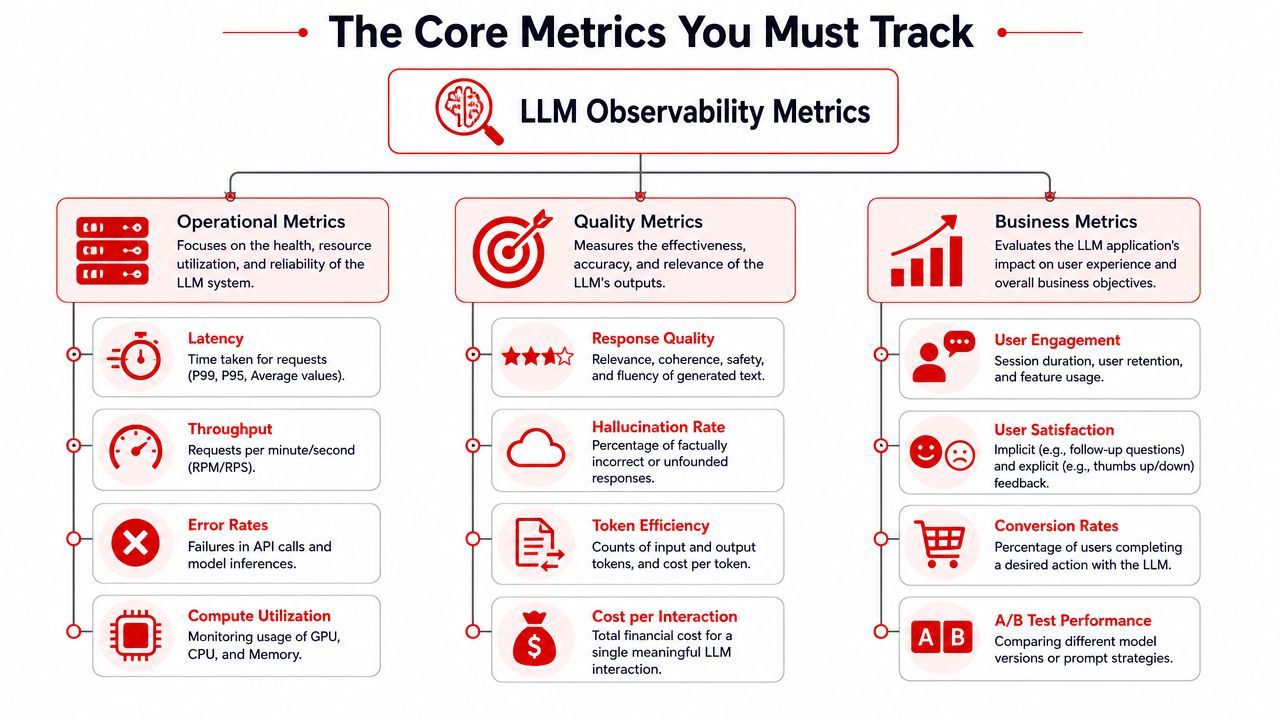
Operational telemetry
This is the layer most engineers already understand. You need it, but you shouldn't stop here.
Track the shape of latency, not just a single average. Honeycomb explicitly calls out p50, p90, and p99 latency distributions because long-tail delays usually hurt users before averages look scary. Pair that with token usage for both input and output so you can attribute cost and catch prompt inflation early.
Watch the operational basics that usually explain infrastructure-side problems:
- Latency distributions so you can spot tail behavior instead of arguing about averages
- Token counts per call, per feature, and per workflow step
- Prompt variations so you can correlate quality or latency shifts with prompt edits
- System metrics like CPU or GPU utilization and disk I/O when you run your own inference or heavy middleware
- Error states such as provider failures, parser failures, timeout paths, and retries
The useful habit is correlation. If p99 got worse after a prompt version changed, that's a different incident from p99 getting worse because retrieval timed out.
A short walkthrough helps:
Input and output payloads
If you don't log the exact prompt and the exact response, you're choosing not to debug reproducibly.
That doesn't mean careless logging. It means capturing payloads deliberately, with redaction rules for sensitive data. For production support, the exact prompt template, variables, retrieved context, tool arguments, and raw model output are often the difference between solving an incident in minutes or losing half a day.
What tends to matter most:
- Prompt version so you know which template ran
- Resolved prompt so you can inspect the final text after variables were injected
- Retrieved context so you can tell whether the model was wrong or the evidence was bad
- Raw model output before cleanup, truncation, or formatter logic changed it
- Post-processed output so you can compare what the model said against what the user saw
Semantic and quality signals
LLM observability becomes meaningfully different from API monitoring.
Track the signals that reflect whether the system did a good job, not just whether it returned quickly. Honeycomb calls out feedback signals like schema validation results, hallucination detection scores, and semantic similarity to user intent. Those are the signals that convert raw logs into quality baselines.
In practice, this means recording signals such as:
A fast wrong answer is still a failed system. If your dashboards only show speed and spend, you'll optimize the wrong thing.
Logging and Tracing Patterns for LLM Apps
A user submits a simple question. The app returns an answer that looks polished, but support tickets start landing because the answer cited the wrong policy, skipped a required field, or used stale context. If your telemetry only shows one successful API call, you have no path to the root cause.
Tracing fixes that by turning one user request into an inspectable execution record. You can see where time went, where cost accumulated, and where quality dropped. That matters in LLM systems because the expensive step is not always the failing step. A slow retrieval stage can starve the model of context. A fast model call can still produce a low-quality answer that passes basic health checks.
Treat each user request like a story
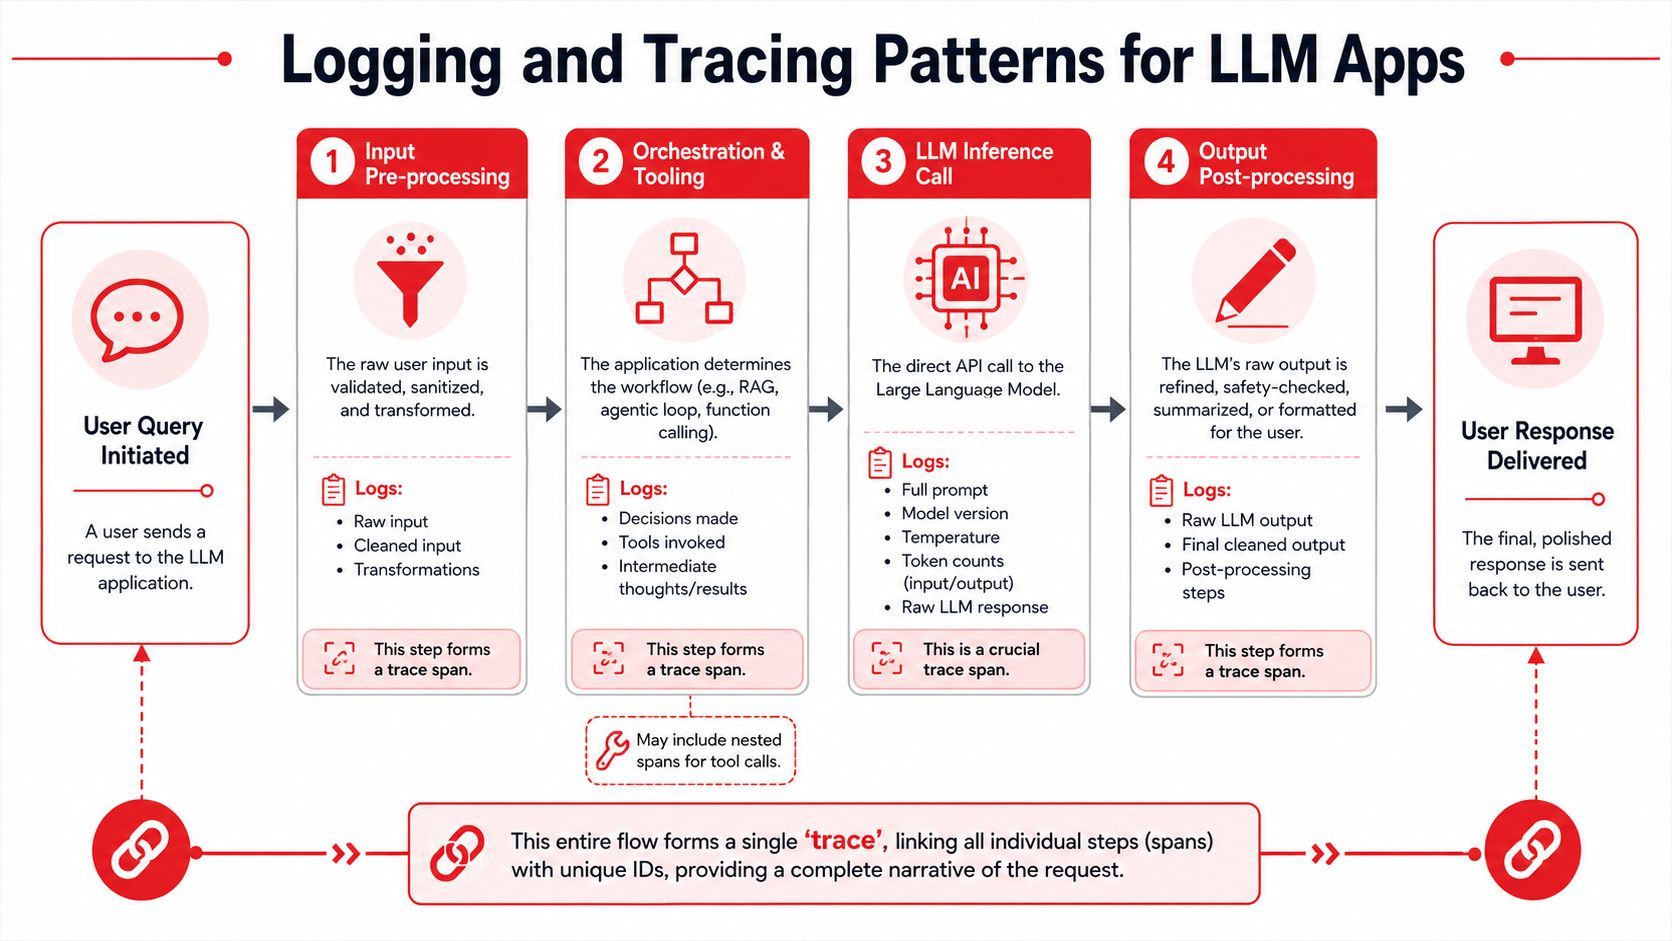
In practice, one user request should map to one trace.
Take a RAG flow. The user asks a question. Your app rewrites it, queries the vector store, reranks documents, assembles context, calls the model, validates the response, and formats the final answer. That entire path belongs in a single trace so you can inspect the full chain when something goes wrong.
Inside that trace, create spans for the steps that can fail independently or change cost and quality:
- Input pre-processing such as normalization, validation, or language detection
- Retrieval work including query generation, document fetch, reranking, and context assembly
- Model inference with prompt, parameters, token counts, and output
- Post-processing such as schema parsing, moderation, or formatting
This is how you debug the failure mode. If latency spikes, the trace shows whether retrieval or inference consumed the time. If answer quality drops, the same trace lets you compare the retrieved evidence, the prompt that was sent, and the output that reached the user. That connection between operational metrics and semantic quality is what basic request logging misses.
Structured logs beat text blobs
Free-form logs stop being useful the first time you need to ask a precise question across thousands of requests.
A real production query sounds like this: show every failed JSON generation for prompt version B on model X, where retrieval returned more than one document, latency stayed under three seconds, and user feedback was negative. You cannot answer that from prose logs.
Use structured JSON events. Record start time, end time, duration, prompt version, model, parameters, token counts, trace ID, span ID, validation results, retrieval metadata, evaluation scores, and error states as fields. Keep raw text where you need it for replay, but make the surrounding metadata machine-readable so you can filter, aggregate, and join it across systems.
Keep logs boring and machine-readable. Humans read dashboards. Systems parse events.
One more practical rule. Separate what happened from what it means. Log the retrieval score, selected document IDs, and schema validation result as facts. Then attach your interpretation layer, such as "hallucination_check_failed" or "low_context_relevance", in a separate field. That keeps your pipelines stable when evaluation logic changes.
Multi provider tracing gets messy fast
Cross-provider setups create schema drift almost immediately. One vendor reports token usage under one field name, another splits prompt and completion tokens differently, and a third gives you only partial metadata. If you compare providers without normalizing those records first, trace analysis becomes unreliable.
Mirantis reports that 41% of enterprises encounter incompatible span schemas in multi-provider workflows, which correlates with 3 to 5 times longer debug times for cross-model failures, according to Mirantis on AI observability and OTEL adoption.
The fix is straightforward, but it takes discipline. Define a canonical event schema at your application boundary. Map every provider response into the same fields for model name, request parameters, token counts, latency, finish reason, tool calls, safety results, and evaluation outputs. Store provider-specific details too, but keep them in a namespaced section so they do not leak into every dashboard and query.
Teams new to multi-provider setups often hit this once they add a second text model, then a speech or image model, and discover their traces no longer line up. Standardize early. It is much easier to add a translation layer now than to clean up six months of inconsistent telemetry after incidents start piling up.
Building Your Observability Stack
A team usually reaches this decision after the first ugly incident. A release goes out, latency looks fine, infra dashboards stay green, and users still complain that answers got worse. At that point, the question is no longer whether to invest in observability. It is whether to build the stack yourself or buy enough of it to shorten the path from failure to diagnosis.
Both options work. They do not cost the same, and they do not fail in the same ways.
The DIY path
Build it yourself if your team already knows how to run telemetry systems and has the appetite to maintain one more internal platform. That usually means OpenTelemetry for traces, structured application events, a storage layer that can handle high-cardinality data, and custom logic to connect request spans with prompts, model parameters, retrieval results, tool calls, token usage, and evaluation outputs.
The upside is control.
You decide the schema, retention policy, redaction rules, and which fields matter enough to index. You can model the system around your product instead of around a vendor's opinionated dashboard. That matters if you have unusual workflows, strict compliance requirements, or multiple model providers with custom routing logic.
The cost shows up later, in boring places:
- Pipeline ownership. Someone has to maintain ingestion, parsing, storage, and backfills when schemas change.
- Evaluation plumbing. Operational metrics are easy to capture. Semantic quality metrics like hallucination, relevance, or answer completeness need separate jobs, labels, or model-based evaluators.
- Replay and debugging tooling. Engineers ask for this almost immediately once incidents start.
- Data joins. Cost, latency, trace context, user feedback, and quality scores are often produced by different systems. If you cannot join them on a stable request ID, you still cannot explain failures.
That last point is where DIY stacks often fall short. Teams get traces and logs working, then realize they still cannot answer a basic production question: "Why did this expensive request produce a bad answer?" Basic observability tells you the request took 11 seconds and used 9,000 tokens. A usable LLM observability stack also shows retrieval returned weak context, the prompt version changed yesterday, and evaluator scores dropped for relevance on that route.
The managed path
A managed layer makes sense when product velocity matters more than owning every piece of telemetry infrastructure. You integrate once, send the right events, and get tracing, session views, prompt comparisons, and model metadata without building each surface yourself.
That saves real engineering time, especially for smaller teams. It also reduces a common failure mode. Internal observability projects often stall after the first tracing milestone, which leaves teams with plenty of raw events and no practical way to inspect quality regressions.
Managed tools still come with trade-offs. They can constrain schemas, make custom analysis harder, and push you toward the vendor's workflow for evaluation and alerting. Data residency and retention rules may also limit what you can send. For regulated products, that can be the deciding factor.
What you usually get in return:
What usually works in practice
The best stack is rarely pure DIY or fully managed. In production, a hybrid setup is common. Teams keep raw telemetry in their own observability or data platform, then use a managed product for faster inspection, evaluation workflows, or prompt regression analysis.
OpenTelemetry's guidance on generative AI instrumentation is useful here because it gives teams a standard way to represent model calls, token usage, and related metadata across tools and backends, as outlined in the OpenTelemetry semantic conventions for generative AI systems.
That standardization matters for one reason. It lets you connect layers that usually live apart. Infra metrics tell you whether the system was slow. Application traces show which step failed. Evaluation signals tell you whether the answer was wrong, off-topic, or unsupported. Put those together and incident review stops being guesswork.
A practical minimum stack should let you answer four questions for any bad request:
- What happened? Full trace of retrieval, model calls, tools, and post-processing.
- What did it cost? Tokens, latency, retries, and provider spend.
- Was the output good? Human feedback, automated evals, or both.
- What changed? Prompt version, model version, routing rule, or retrieved context.
If your stack cannot answer all four, keep building. Fast insight beats elegant architecture every time.
From Data to Decisions with Dashboards and Alerting
Raw logs are not observability. They're ingredients.
A useful dashboard answers product and engineering questions without forcing someone to manually reconstruct every incident. If a team has to open individual traces all day just to understand basic trends, the dashboard layer is failing them.
Dashboards should answer product questions
The most useful LLM dashboards usually center on slices of behavior, not on infrastructure vanity charts.
A good setup often includes views like:
- Cost by feature or workflow so teams know which user paths are expensive
- Latency distribution by step so retrieval, inference, and post-processing can be compared
- Prompt or model version comparisons to spot regressions after changes
- Validation failure leaderboards to show which prompts break schemas most often
- Negative feedback clusters to connect quality problems to specific flows
The goal is operational judgment. A team should be able to answer, “Which feature got slower after the last rollout?” or “Which workflow is consuming the most tokens without good outcomes?”
Alerts should fire on LLM failure modes
Basic server alerts still matter, but they won't catch many of the failures users feel.
Good LLM alerting is narrower and smarter. It watches for deviations from your baseline behavior and ties them to meaningful slices of the system. The earlier guidance from Honeycomb and Galileo supports dynamic thresholds over fixed trigger values because model behavior changes over time and naive alerts get noisy.
A few alerts that are worth implementing early:
- A spike in schema validation failures for a single prompt version
- A jump in cost per interaction after a model routing change
- A p99 latency regression isolated to one feature or agent path
- A rise in low-relevance or poor-grounding outputs for a retrieval workflow
- A safety or policy violation burst on a specific user segment or tool path
Don't page people because a model was slow once. Page them when a meaningful slice of user experience or cost behavior moves outside its normal range.
The point of dashboards and alerts isn't visibility for its own sake. It's faster decisions. Ship the fix, roll back the prompt, change the route, trim the context, or disable the failing path.
Common Pitfalls and Your Starter Checklist
The painful failures usually start with a dashboard that looks fine.
Latency is stable. Spend is within budget. Error rates are low. Meanwhile, users are getting irrelevant answers, retrieval is pulling the wrong documents, and a prompt change insidiously dropped output quality for one workflow that matters to revenue. That is the gap teams need to close. LLM observability has to connect operational signals with semantic ones so you can explain why the system is failing, not just confirm that requests are still going through.
A lot of teams make the same mistake early. They instrument what is easy to measure and skip what is hard to evaluate. They collect token counts, provider timings, and HTTP errors, but they do not log enough context to reproduce a bad answer or tie poor outputs to a prompt version, retrieval path, or model route.
Galileo describes this as a split between monitoring system health and understanding model behavior in production, in its comparison of monitoring and observability for LLM systems: https://galileo.ai/blog/llm-monitoring-vs-observability-understanding-the-key-differences.
Mistakes that waste the most time
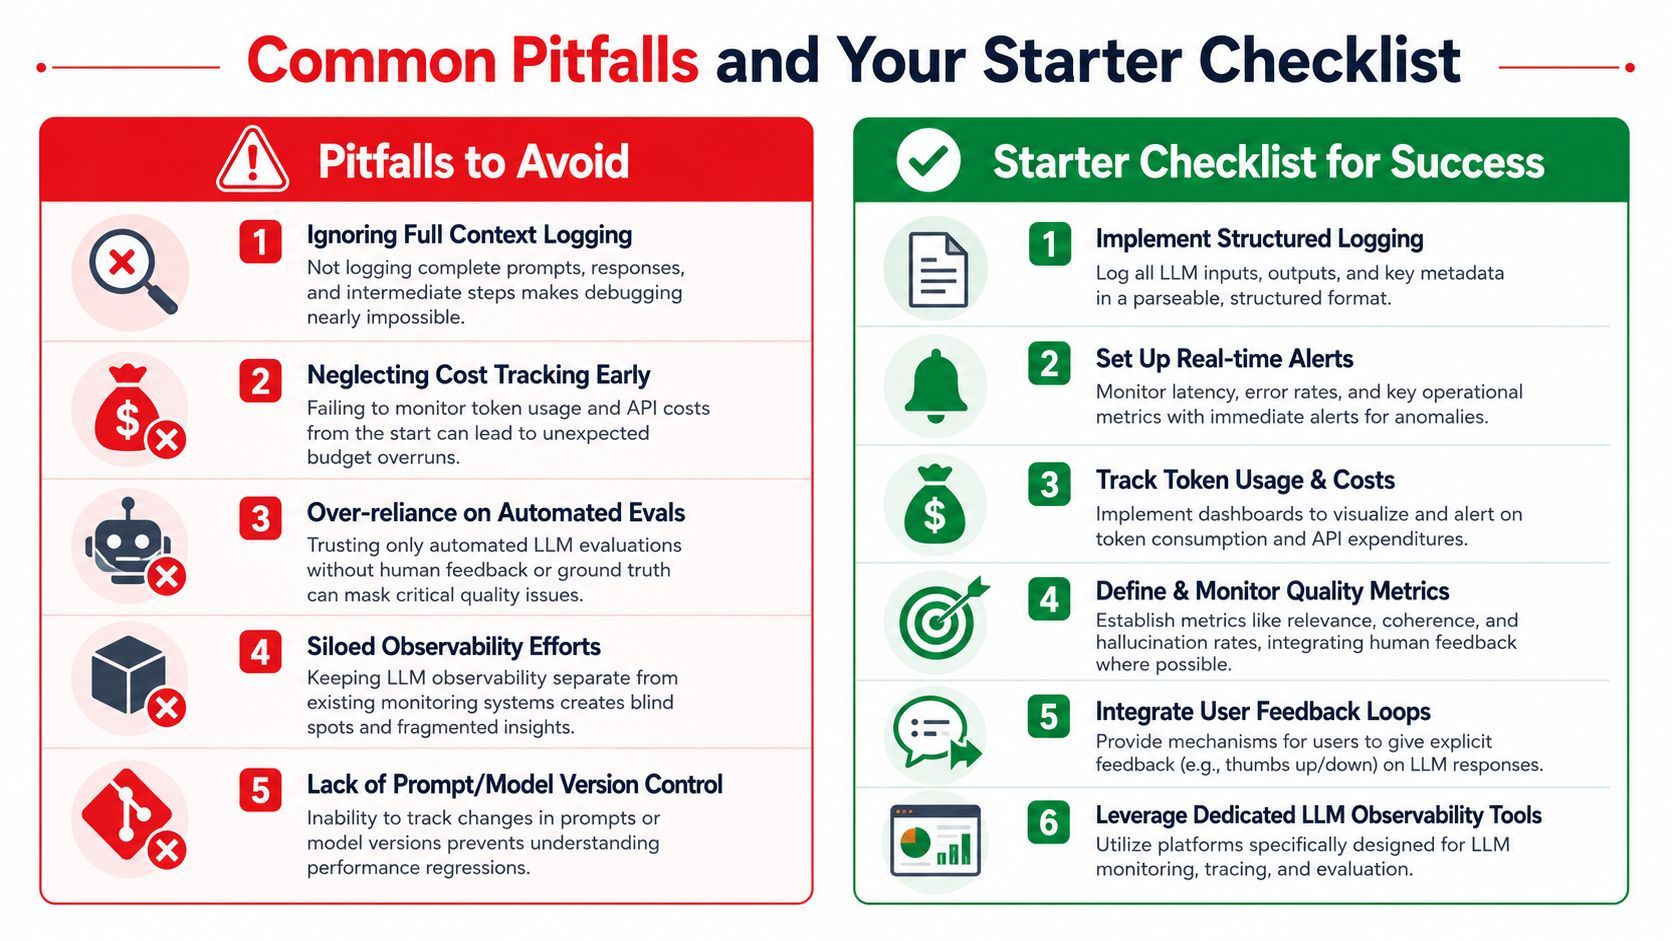
These failures are expensive because they slow down debugging and hide the actual cause of regressions:
- Tracking only latency and cost while missing relevance, hallucination, grounding, or schema quality
- Skipping full context logging so nobody can replay the bad run with the prompt, retrieved context, tool calls, and final output
- Ignoring prompt and model versioning which turns regression analysis into guesswork
- Logging sensitive data carelessly instead of redacting fields, limiting retention, and scoping access
- Treating evals as separate from telemetry so quality results never get attached to traces, segments, or releases
A Practical Starter Checklist
A useful first setup is smaller than many teams expect, but it has to be disciplined.
- Instrument every LLM call with a trace ID that survives retrieval, tool execution, validation, and response delivery.
- Store structured logs as JSON with prompt version, model, input shape, output, duration, token usage, and error state.
- Capture both raw and post-processed outputs so parser bugs, truncation, or cleanup code do not hide model behavior.
- Record at least one semantic quality signal such as schema pass or fail, grounding status, retrieval relevance, or explicit user feedback.
- Build dashboards by feature or workflow so cost, latency, and quality can be compared in the same slice of the product.
- Add a small set of targeted alerts for validation failures, cost spikes, latency regressions, and quality drops tied to specific versions or routes.
If a team does those six things well, incident response gets much faster. You can tell whether the problem came from the model, the prompt, the retrieval layer, the parser, or your own product logic.
If you want a faster path to production than wiring all of this together yourself, Supagen is worth a look. It gives teams a unified AI backend for prompt management, model routing across providers, per-call observability, cost tracking, and dashboard-driven iteration, so you can ship AI features and agents without hardcoding that operational layer into your app.