
How to Reduce Latency: Proven Strategies
Your chatbot is live, users are typing, and the reply still feels late even though the API call “succeeds” fast. The trap is that AI latency doesn't behave like a normal CRUD endpoint, because the user is watching the response arrive in pieces, and every pause between those pieces is part of the experience. If you've been tuning the wrong layer, the system can look healthy in logs and still feel slow in production.
Table of Contents
- Why AI Latency Feels Different
- Instrumenting the Full Request Lifecycle
- Latency Attribution Breakdown
- Effective Streaming, Batching, and Caching Strategies
- Model Selection and Routing Strategies
- Designing UX Around a Realistic Latency Budget
- Key Metrics and Common Anti-Patterns
Why AI Latency Feels Different
A founder once asked why their support bot felt “broken” when the logs showed a sub-second response from the API. The answer was simple, and annoying. The server returned quickly, but the first token didn't appear fast enough, then the stream arrived unevenly, and the user experienced the delay as hesitation, not success.
That's the part most how to reduce latency guides miss. Traditional web latency usually ends when the server responds, but an LLM request keeps the connection open while tokens stream back, so the user watches the system think. Time-to-first-token matters because it shapes the first impression, and token cadence matters because it shapes the rest.
Measure three stages separately
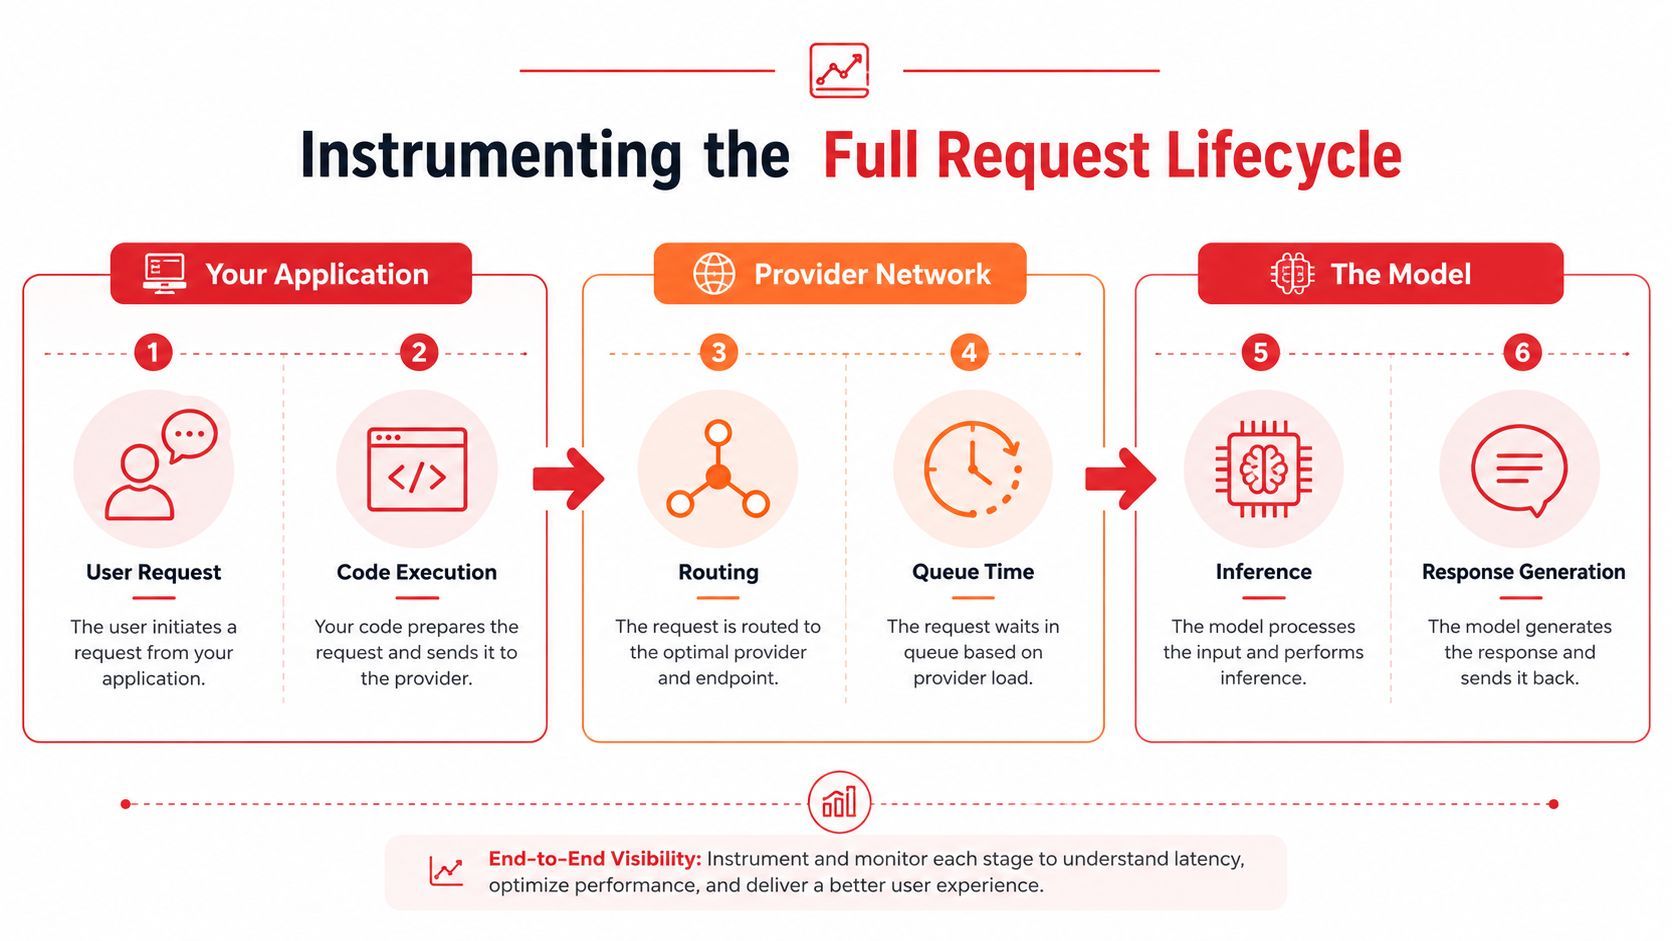
The cleanest mental model is to split an AI request into request overhead, model inference, and streaming delivery. Request overhead covers your app, auth, serialization, and provider handoff. Model inference covers the provider's actual generation time. Streaming delivery covers how quickly the client receives and renders the output chunks.
Practical rule: if the feature feels slow but the total request duration looks acceptable, the bottleneck is often in the first token, not the final token.
AI latency diverges from classic API tuning. Network delay is only one part of the picture, and the overall experience also includes processing and queueing, which is why measurement has to start with the shortest and most efficient route rather than a generic “make it faster” instinct, as noted in the latency optimization guidance from One Nought One. In practice, the user doesn't care which layer is guilty. They care whether the assistant starts responding immediately and keeps moving.
Instrumenting the Full Request Lifecycle
If you can't separate the stages, you'll end up optimizing whichever metric is easiest to graph. That's usually the wrong one. LLM systems need tracing across your app, the provider network, and the model itself, because the request lifecycle spans more than one system and the slowest part can move from one call to the next.
Capture the fields that explain user complaints
Every LLM call should log time-to-first-token, total duration, prompt size, completion size, token counts, and provider region. Add a request ID, model name, route chosen, and whether the response streamed or returned in one shot. If you're using OpenTelemetry or a similar tracing system, make sure the span covers the outbound call and the client-side render handoff.
The point is not to build a giant observability project. The point is to answer one question quickly, which is whether the delay came from your code, the provider, or the model. Percentile alerts matter here, because averages can look fine while a small set of slow requests dominates the complaints users remember. The practical low-latency guidance also emphasizes P99, not averages, because rare slow requests are what people feel most.
Read the logs like a timeline
When a user says, “the bot stalled on this question,” trace that exact request ID. If the provider region is far from the user, the path itself may be part of the issue, since physical distance and route choice affect propagation delay and routing overhead, as explained in Equinix's latency guidance. If the region is fine but the first token is late, the model or queue is the likely culprit. If the first token is quick but the response appears in bursts, the client rendering path deserves attention.
A useful dashboard makes this obvious without guesswork. A unified per-call view should let you compare token timing, latency, and route on the same screen, then filter outliers by provider, region, or prompt length. That's the difference between staring at system health and debugging user pain.
Latency Attribution Breakdown
AI latency usually looks like one number until you break it apart. Once you do, the same request often turns out to be a stack of smaller waits, and the biggest one changes with architecture, traffic, and provider behavior. A cloud-focused analysis estimated average latency contributions of 20 to 80 ms for network delay, 10 to 50 ms for compute delay, and 5 to 100 ms for storage delay, which is a useful reminder that the bottleneck moves around WJARR.
Use a four-bucket attribution model
The cleanest breakdown is network travel, provider queueing, model inference, and application processing. Network travel is the time spent moving requests and responses across the path. Provider queueing is the wait before your request gets compute. Model inference is the token generation itself. Application processing is everything your code does before and after the call.
The exact ranges above depend on the system, so treat the table as a diagnostic map, not a promise. The useful part is the matching logic. If the wait is before the first token, the delay is usually in queueing, routing, or inference startup. If the wait shows up after the first token, your streaming path may be buffering too much data.
Working rule: never tune the client until you know whether the delay lives before generation, during generation, or after generation.
That distinction matters because some optimizations only help one bucket. Shortening prompts helps inference. Better routing helps network travel and queueing. Faster UI code helps rendering, but not the model. Teams lose weeks when they treat every delay as one problem.
Effective Streaming, Batching, and Caching Strategies
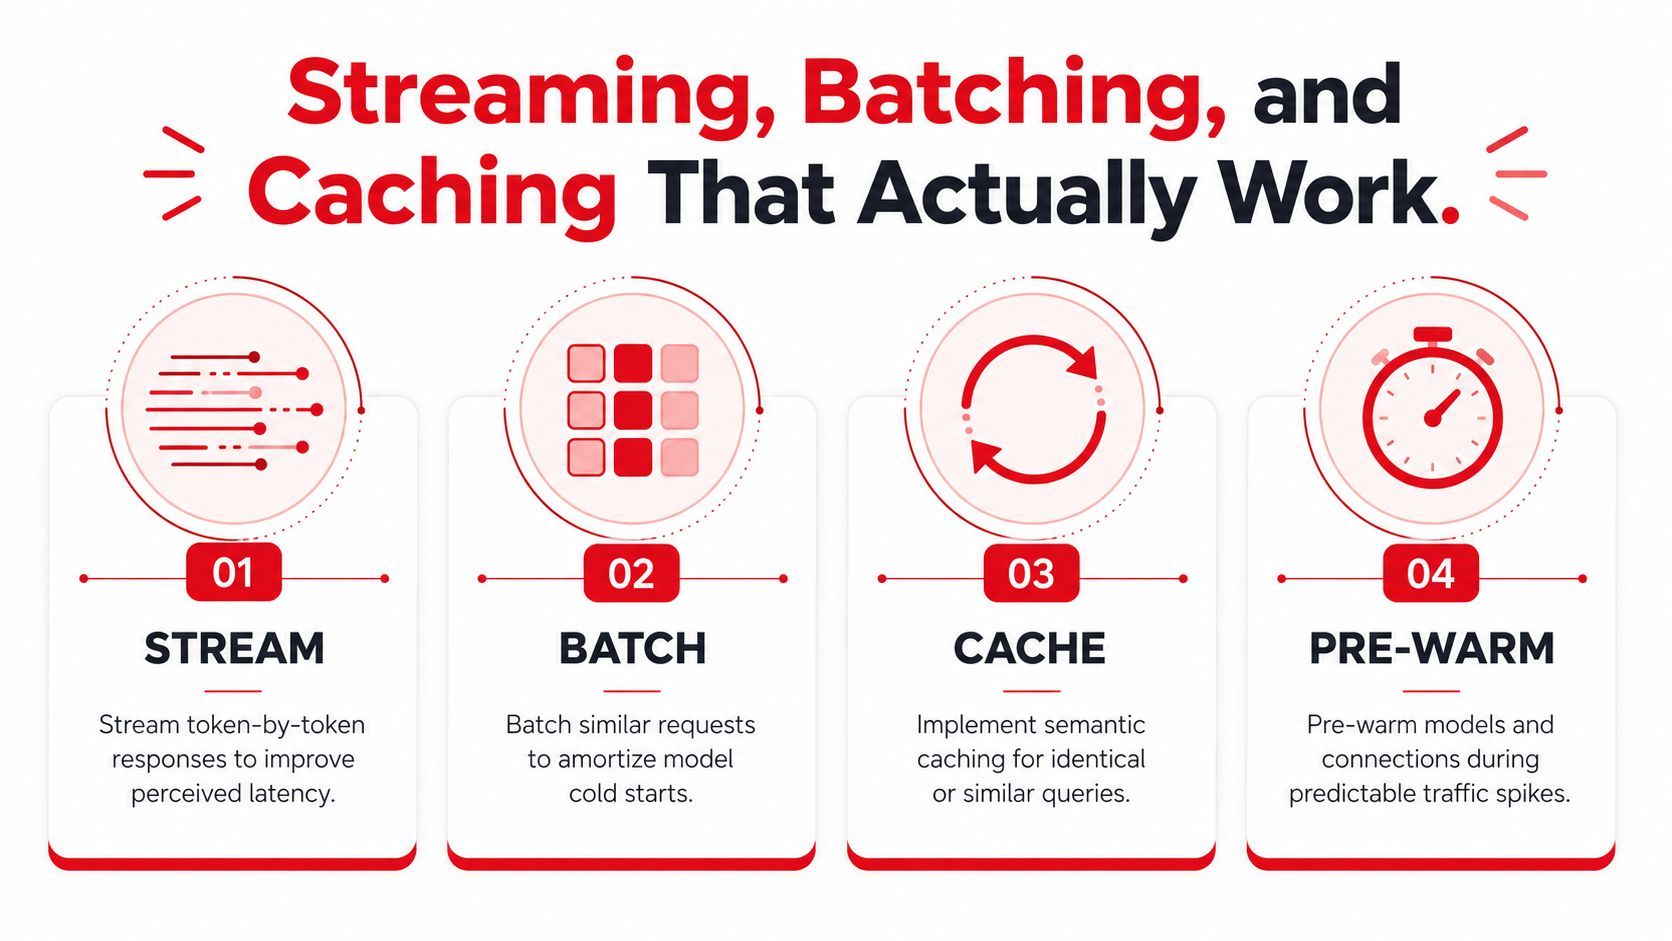
The easiest win in AI features is usually not making the model smarter. It is stopping the user from waiting for the entire response at once. Stream output when the UX can handle partial text, batch independent calls when you are paying repeated round trips, and cache repeated requests so the model never runs for common cases. These are separate tools, and each one reduces a different kind of delay in the request lifecycle.
Stream when the answer can arrive in pieces
Streaming has the biggest effect on perceived latency because the user sees progress before the full completion is ready. The client can render tokens as they arrive, so a chat reply, draft, or summary feels responsive even when total generation time barely changes. In production, that matters more than shaving a small amount off the backend when the user is staring at an empty panel.
The trade-off is client complexity. You need to handle buffering, partial JSON, retries, and the occasional uneven burst where tokens arrive in clumps. If your UI expects one clean object, do not force stream-based delivery into it without a parser or an envelope format. Streaming helps the user, but only when the front end can tolerate unfinished output without breaking state.
Batch and cache with intent
Batching helps when the application makes several independent calls that do not need to block one another. If a classifier, a retriever, and a summarizer run in sequence just because the code grew that way, the critical path gets longer for no good reason. Running those calls in parallel, or combining them where the provider supports it, can cut round trips, and the low-latency guidance around distributed systems still points to the same basics, reduce round trips, reuse connections, and keep payloads compact with formats such as Protocol Buffers or MessagePack where the stack allows it github.com/penberg/awesome-low-latency.
Caching serves a different purpose. Exact-match caching works best for repeated prompts, repeated document summaries, and fixed workflows with stable inputs. Semantic caching can help when users ask similar questions, but the boundaries have to stay tight so a near match does not leak an answer into the wrong context. Use cache hits to skip the model, not to hide logic bugs or mask stale data.
Prompt compression is the quiet win. Fewer input tokens usually mean less work for the model and less data to move through the system, which helps when the prompt carries duplicated instructions, repeated history, or long retrieved passages. The fastest prompt is the one you never send.
Model Selection and Routing Strategies
Not every request deserves the same path. A short factual question, a long reasoning task, and a multimodal generation call should not all go to the same model if your product cares about latency and cost. Routing is where a lot of teams leave easy wins on the table, because the fastest route is often the one that sends the simplest requests somewhere cheaper and closer.
Choose the routing shape that matches the product
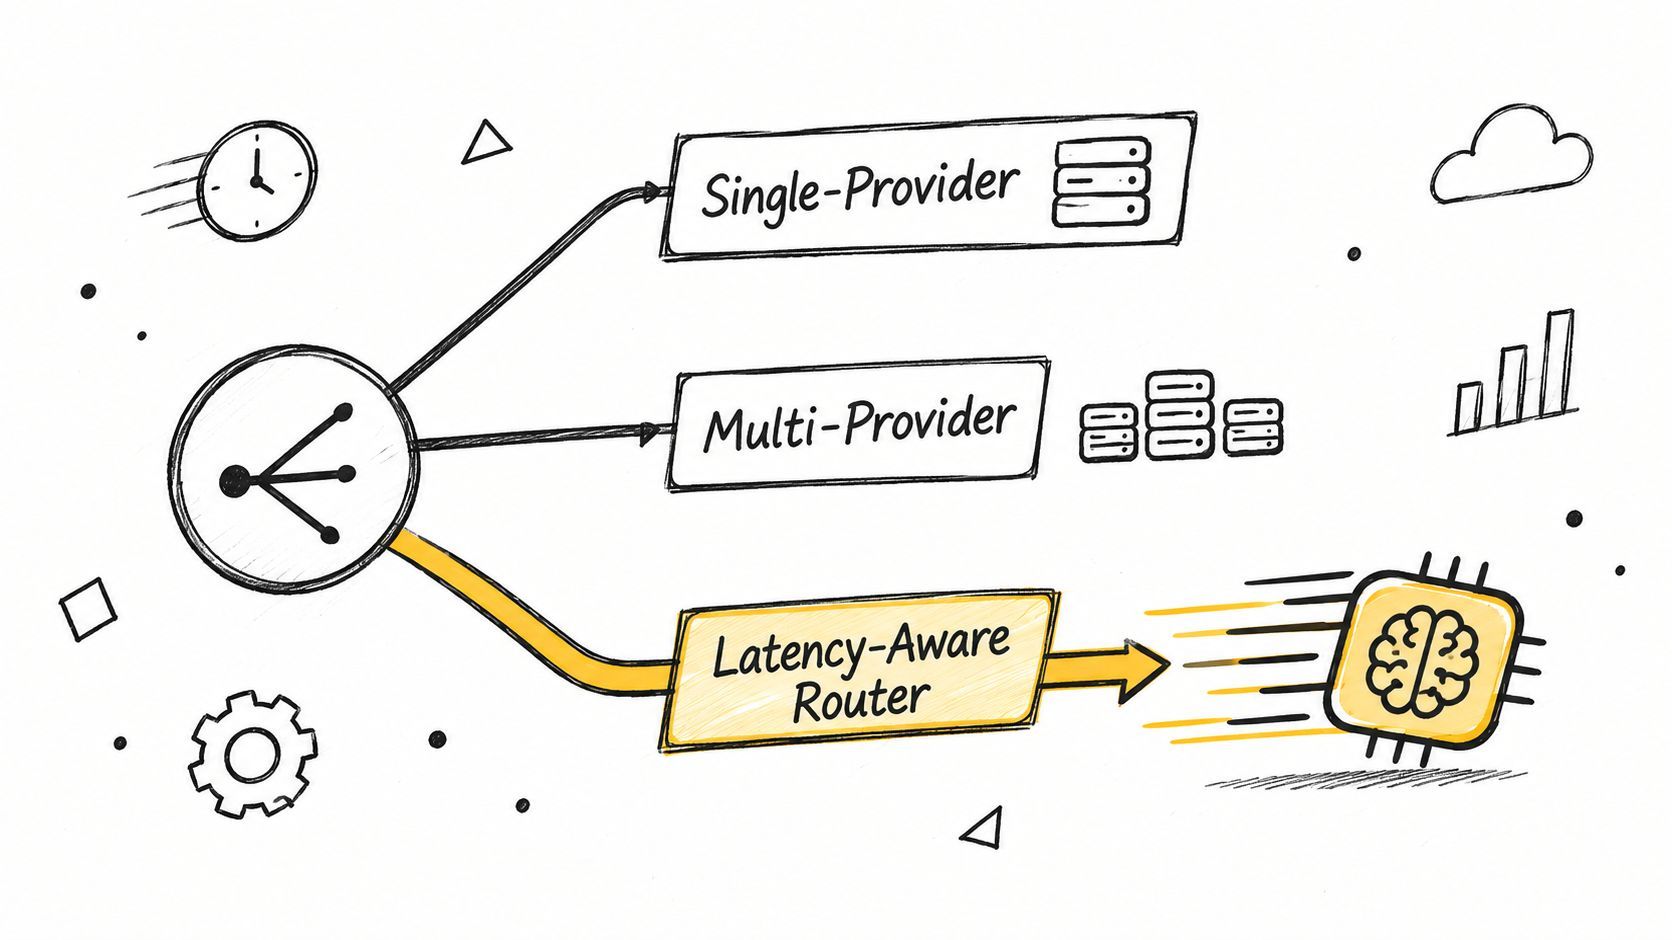
Single-provider routing is easiest to reason about. One integration, one failure mode, one place to inspect logs. It works well early, especially when the feature is small and the team needs a stable baseline more than advanced fallback logic.
Multi-provider fallback is about resilience, not brilliance. If one provider is degraded or a region gets slow, a backup path keeps the feature usable. The trade-off is complexity, because prompt formats, tool behavior, and streaming quirks can differ across providers. You gain uptime, but you also gain more cases to observe.
Tiered routing is usually the best fit once traffic becomes mixed. Fast, cheap models can answer straightforward prompts, while larger models handle tasks that need deeper reasoning or richer multimodal behavior. That lets you spend latency budget where the user benefits from it, instead of sending every request through the slow lane.
Route by region when distance is part of the problem
Region matters because latency is partly a distance problem. In fiber, propagation is often approximated at about 5 microseconds per kilometer, so a 1,000-kilometer path adds roughly 5 milliseconds one way before routing, processing, or queueing overhead, according to One Nought One's latency guidance. That's why edge locations, regional deployments, and CDN points of presence can materially improve response times for distributed apps.
Rule of thumb: if the user base is spread across geographies, route for proximity first, then optimize the model second.
A unified backend helps here because it lets you change routing rules without rebuilding the app every time the traffic pattern changes. That's useful when the key question is not “which model is best,” but “which model is fast enough, close enough, and reliable enough for this request class.”
Designing UX Around a Realistic Latency Budget
A fast backend still needs a patient interface. AI features spike and wobble in ways standard app screens don't, so the product layer has to absorb variance instead of pretending it doesn't exist. The goal is perceived speed, not a fantasy of instant compute.
Make the interface progress as soon as possible
Streaming text into the UI is the most obvious move, but it's not the only one. Skeleton states tell users the system is active, optimistic updates keep adjacent actions moving, and typed indicators make long-running generation feel deliberate instead of frozen. The right pattern depends on the action.
If the interaction is exploratory, like a chat reply or outline draft, partial output is usually fine. If the interaction is transactional, like a JSON object that drives the next step of the app, you may need to hold the UI until the payload is valid. The product decision is not “stream or don't stream.” It's “what can the user safely use before the final byte arrives.”
Budget for worst-case behavior, not happy-path demos
Latency budgets should be tied to feature criticality. A search helper can tolerate more drift than a checkout assistant. A background summary can take longer than an in-page autocomplete. The product team should define which interactions are latency-critical, then set expectations for engineering around the user's actual tolerance.
The MDN performance guidance separates latency from jitter and reminds teams that latency is only one part of the performance experience MDN. That distinction matters in AI UIs because a fast benchmark can still feel worse than a slower one if the output arrives in jagged bursts. Smoothness wins more trust than raw speed alone.
Key Metrics and Common Anti-Patterns
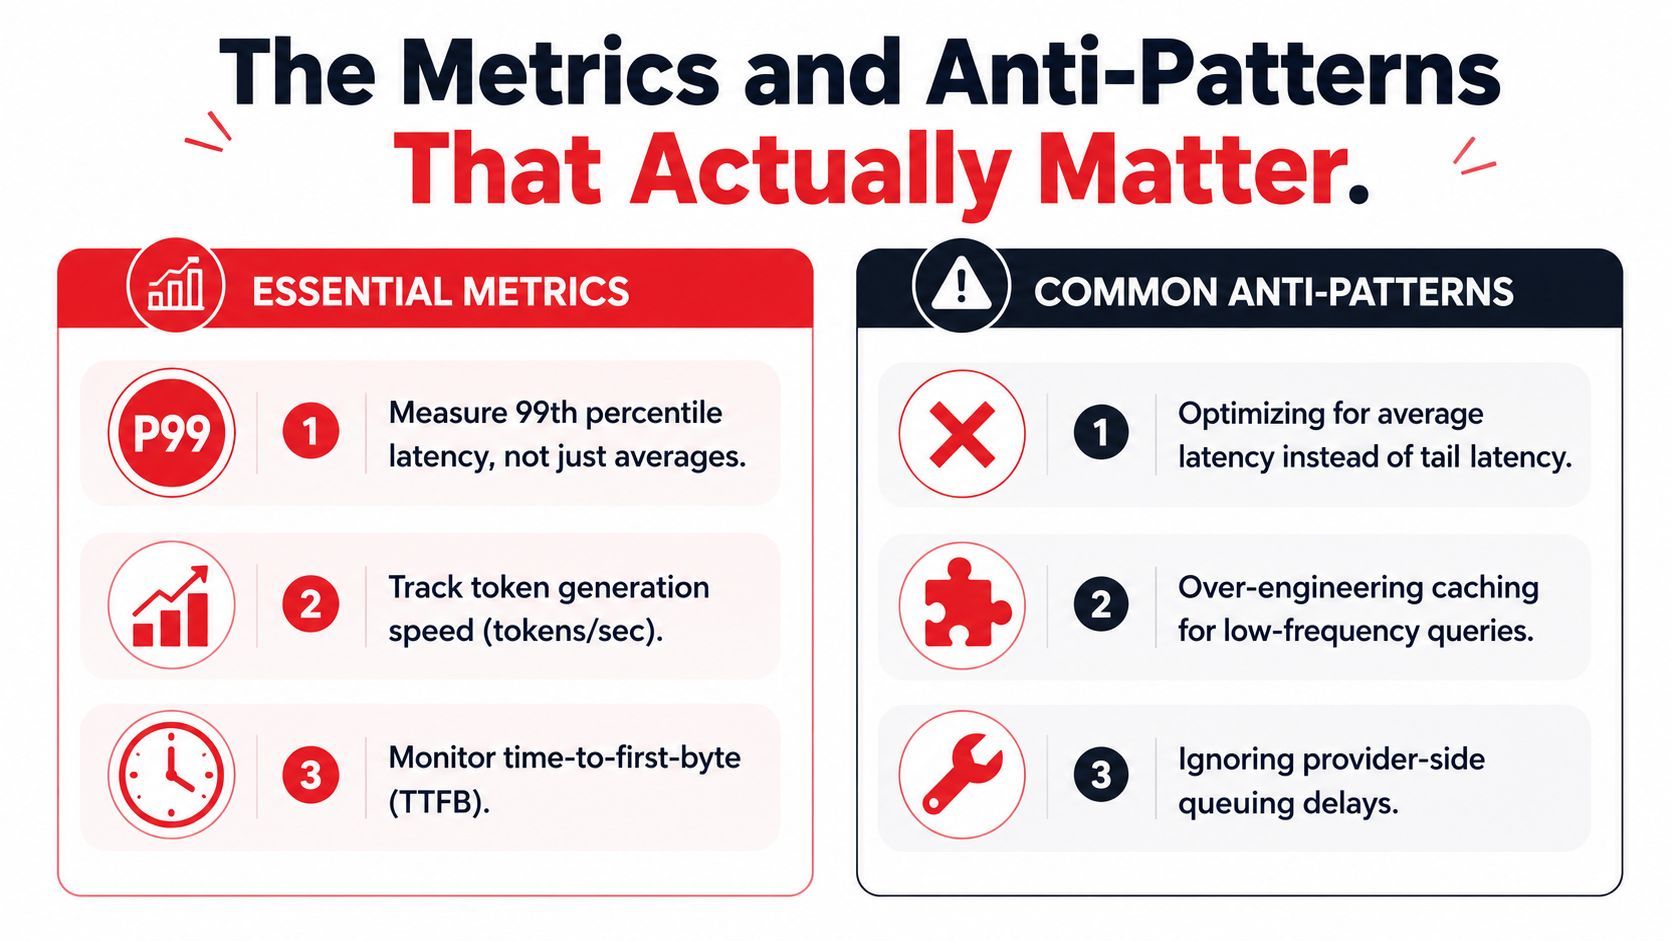
The most common mistake in latency work is measuring the wrong thing and celebrating the wrong win. Averages make dashboards look tidy, but they hide the slow tail that users remember. For AI features, P99 latency is usually the metric that tells the truth, because the rare slow request is the one that gets screenshotted, copied into a complaint, or blamed on your product.
Track the metrics that map to user pain
The three metrics that usually matter most are P99 latency, token generation speed, and time-to-first-byte. P99 tells you what the slow tail is doing. Token generation speed tells you whether the model is moving once it starts. Time-to-first-byte tells you whether the user sees the first sign of progress quickly enough.
Those three numbers cover different parts of the request lifecycle, and that matters. A request can have a quick network round trip, a slow provider queue, and a sluggish decode phase, while still looking fine if you only watch one aggregate timer. If you are building AI features, the useful question is which stage is dragging, because the fix changes depending on whether the delay is in routing, inference, or streaming.
Avoid the fixes that waste weeks
The first anti-pattern is tuning for averages. Averages can improve while the slowest calls stay painful. The second is over-engineering caching for low-frequency prompts, where cache complexity creates more maintenance than value. The third is ignoring provider-side queueing delays, which are often the hidden reason a route looks fine on paper but feels sluggish in production.
Buying more bandwidth is another weak instinct. Network latency guidance from Netrality makes the same practical point, path selection, proximity to users, and topology usually matter more than raw bandwidth when the goal is to cut user-visible delay. For a global product, focus on routing, edge placement, and the primary bottleneck before you spend effort on capacity theater.
A sane troubleshooting checklist is short. Check whether the slow calls cluster by region. Check whether the first token moved while the total duration stayed flat. Check whether the tail got worse after a prompt or model change. Then fix the layer that changed.
If the slow path is inside the model request itself, backend abstraction helps more than another dashboard. A unified layer like Supagen can centralize prompts, model routing, observability, and cost tracking, which makes it easier to compare providers and isolate where latency is coming from without hardcoding every provider-specific knob into the app.