10 Best Practices for Logging in AI Products: 2026 Guide
Beyond print(): Why Your AI Product Is a Black Box Without Proper Logging
A flagship AI feature can fail without throwing anything obvious. Users get inconsistent answers, support starts hearing about “weird behavior,” spend creeps up, and nobody on the team can explain whether the problem started in your app, the model provider, the prompt template, or the fallback path. That's the moment when weak logging stops being a nuisance and starts becoming a business risk.
AI products are harder to debug than normal CRUD apps. Outputs are non-deterministic. One user request can trigger several model calls, retrieval steps, tool executions, retries, and provider failovers. Every one of those calls also has a direct cost attached, which means poor visibility doesn't just slow debugging. It can also hide waste.
The usual advice on best practices for logging often stops at “use structured logs” and “log errors.” That's necessary, but it isn't enough for teams shipping features on OpenAI, Anthropic, Google, ElevenLabs, or mixed provider stacks. You need logs that explain behavior, performance, and spend without exposing raw prompt data you shouldn't retain.
Good logging turns an AI black box into a control tower. You can trace one user action through your system, see which model handled it, understand why routing changed, catch regressions after a prompt update, and spot expensive workflows before the bill forces the issue.
Table of Contents
- 1. Structured Logging with JSON Format
- 2. Contextual Logging with Correlation IDs
- 3. Log Aggregation and Centralized Storage
- 4. Comprehensive Error and Exception Logging
- 5. Performance and Latency Logging
- 6. Cost and Usage Tracking Logs
- 7. Model and Prompt Version Logging
- 8. Provider Fallback and Routing Decision Logging
- 9. Input Sanitization and Output Validation Logging
- 10. Sampling, Filtering, and Log Level Management
- 10-Point Logging Best Practices Comparison
- From Black Box to Control Tower Unifying Your AI Observability
1. Structured Logging with JSON Format
Free-form log strings feel fast when you're prototyping. They're painful the first time you need to answer a simple question like: “Which Anthropic requests timed out after we changed the prompt?” If your logs are blobs of text, you end up grepping fragments instead of querying fields.
Structured logging fixes that. Honeycomb recommends using structured formats such as JSON or XML, assigning unique request identifiers, and centralizing logs at creation time so related events can be aggregated into a coherent record. Heroku also notes that JSON is the de facto standard for structured application logging, and AWS recommends limiting routine application logging to 400-level and 500-level responses so logs stay actionable and don't turn into noise, as summarized in Honeycomb's logging best practices guide.
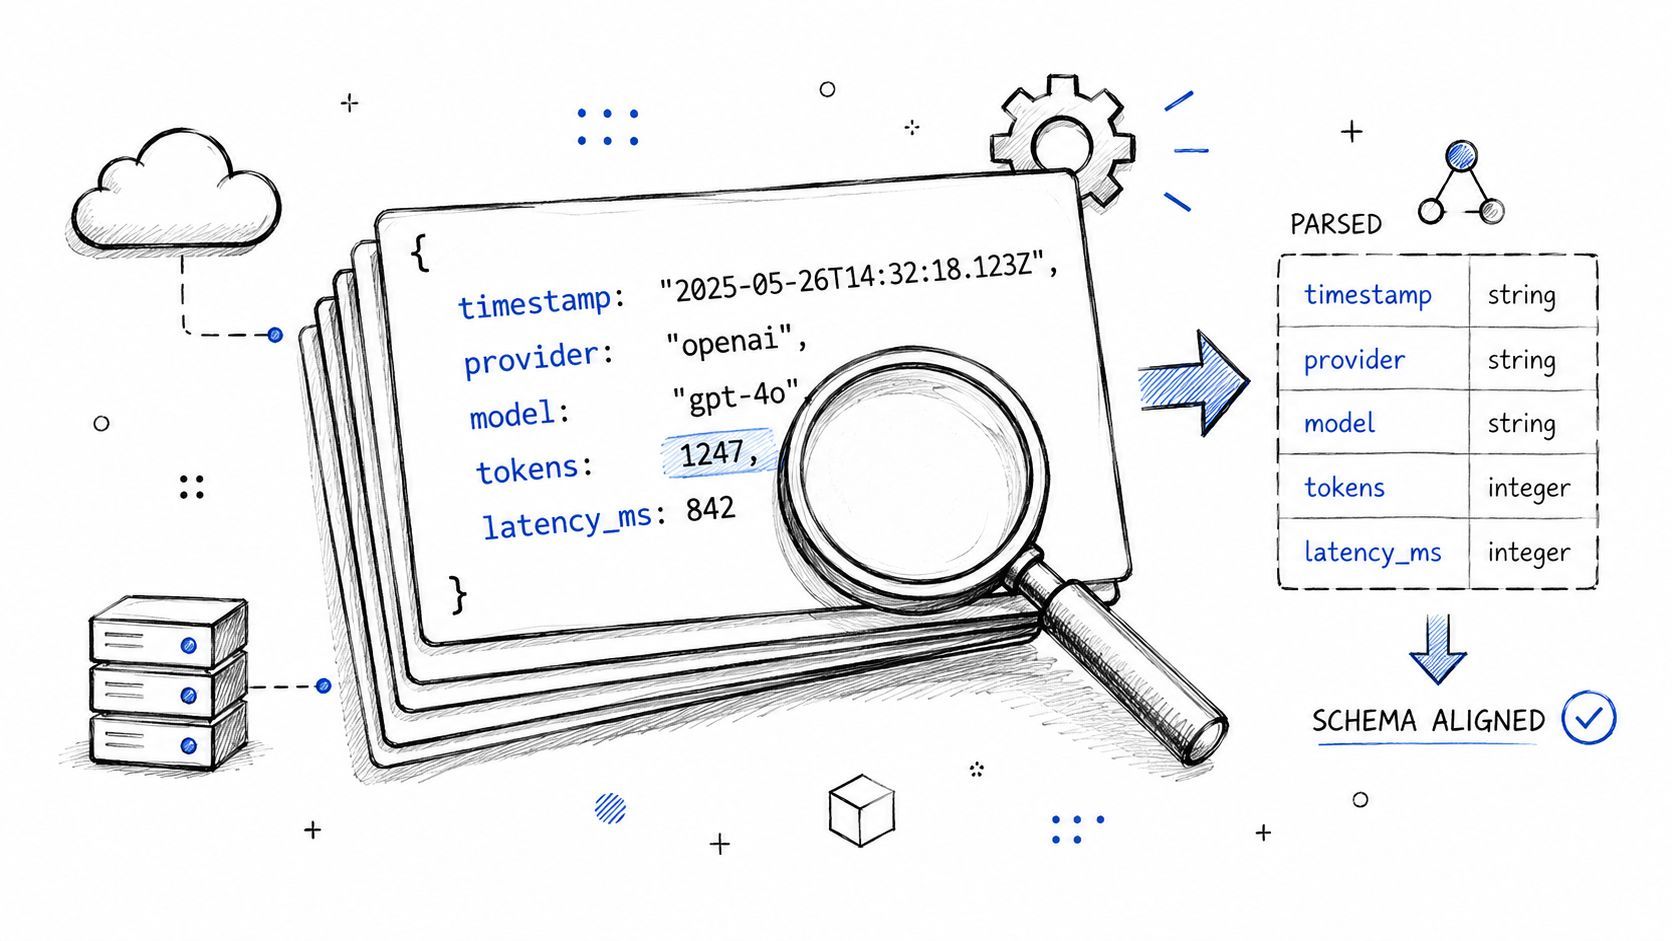
Make every AI event machine-readable
For AI products, the schema matters as much as the format. A useful JSON log for a model call usually includes provider, model, environment, request ID, latency, token counts, status, and a sanitized summary of what happened. If you route between OpenAI and Anthropic, those fields need the same names every time or your dashboards become a mess.
A practical example: a customer support assistant receives one question, your backend retrieves context, calls OpenAI first, falls back to Anthropic on timeout, and then formats the answer for the UI. With structured JSON logs, each step is queryable. Without them, the story of that request gets scattered across text output from different services.
- Define one schema early: Pick canonical field names like
provider,model,request_id,latency_ms,input_tokens,output_tokens, andenvironment. - Log success and failure the same way: If failed calls use a different shape, your queries break when you need them most.
- Store sanitized I/O metadata, not raw secrets: For prompts and user inputs, log hashes, lengths, template IDs, or classifications when raw text would create privacy risk.
Practical rule: If a log line can't be filtered by field, it isn't production-grade logging for an AI system.
2. Contextual Logging with Correlation IDs
Most AI failures aren't single-event failures. They're chains. An API request starts in your app, triggers retrieval, calls one provider, retries on another, passes through moderation or validation, and only then returns something to the user. If those events don't share an identifier, you're debugging by intuition.
Correlation IDs solve that. One ID enters with the user request and follows every downstream action. That includes background jobs, queue messages, tool calls, and fallback requests.
Follow one request across the whole workflow
Say a content generation flow starts with a user clicking “Generate campaign.” Your app prepares context, calls OpenAI for copy, sends the draft through Anthropic for revision, then asks ElevenLabs for audio. A single correlation ID lets you reconstruct the whole path in seconds instead of opening three dashboards and matching timestamps by hand.
The implementation detail that teams often miss is propagation. It isn't enough to generate a correlation ID at the edge. You have to pass it through HTTP headers, async tasks, message queues, and any wrapper you use around provider SDKs.
Here's a solid pattern:
- Create the ID at the entry point: API gateway, webhook handler, or frontend-triggered request.
- Attach it everywhere: Put it in application log context and outbound request headers.
- Persist it in provider wrappers: Every OpenAI or Anthropic helper should automatically add the same ID to its logs.
- Return it when helpful: Including a request ID in admin tooling or support views makes incident triage much faster.
A good walkthrough on request tracing and distributed context is this video on correlation IDs in observability workflows.
When a PM says, “This answer looked wrong,” the first useful question isn't “What model did we use?” It's “What's the correlation ID for that interaction?”
3. Log Aggregation and Centralized Storage
If your logs live in five places, you don't have observability. You have scavenger hunts.
This hits AI teams harder than normal because provider activity, app behavior, queue workers, and infrastructure events all matter at once. Elastic's guidance recommends centralizing logs from all relevant sources into one searchable platform and storing them in a structured, machine-readable format such as JSON, because that makes correlation across application, infrastructure, network, and cloud events practical at scale, as explained in Elastic's logging best practices for observability.
Put every provider and service in one searchable place
A multi-provider product might generate logs from your API, job workers, vector store, auth layer, OpenAI calls, Anthropic calls, Google generation requests, and speech or image services. If each source has its own silo, nobody can answer cross-cutting questions like “Did latency spike before fallback rates changed?” or “Which environment started producing malformed JSON responses?”
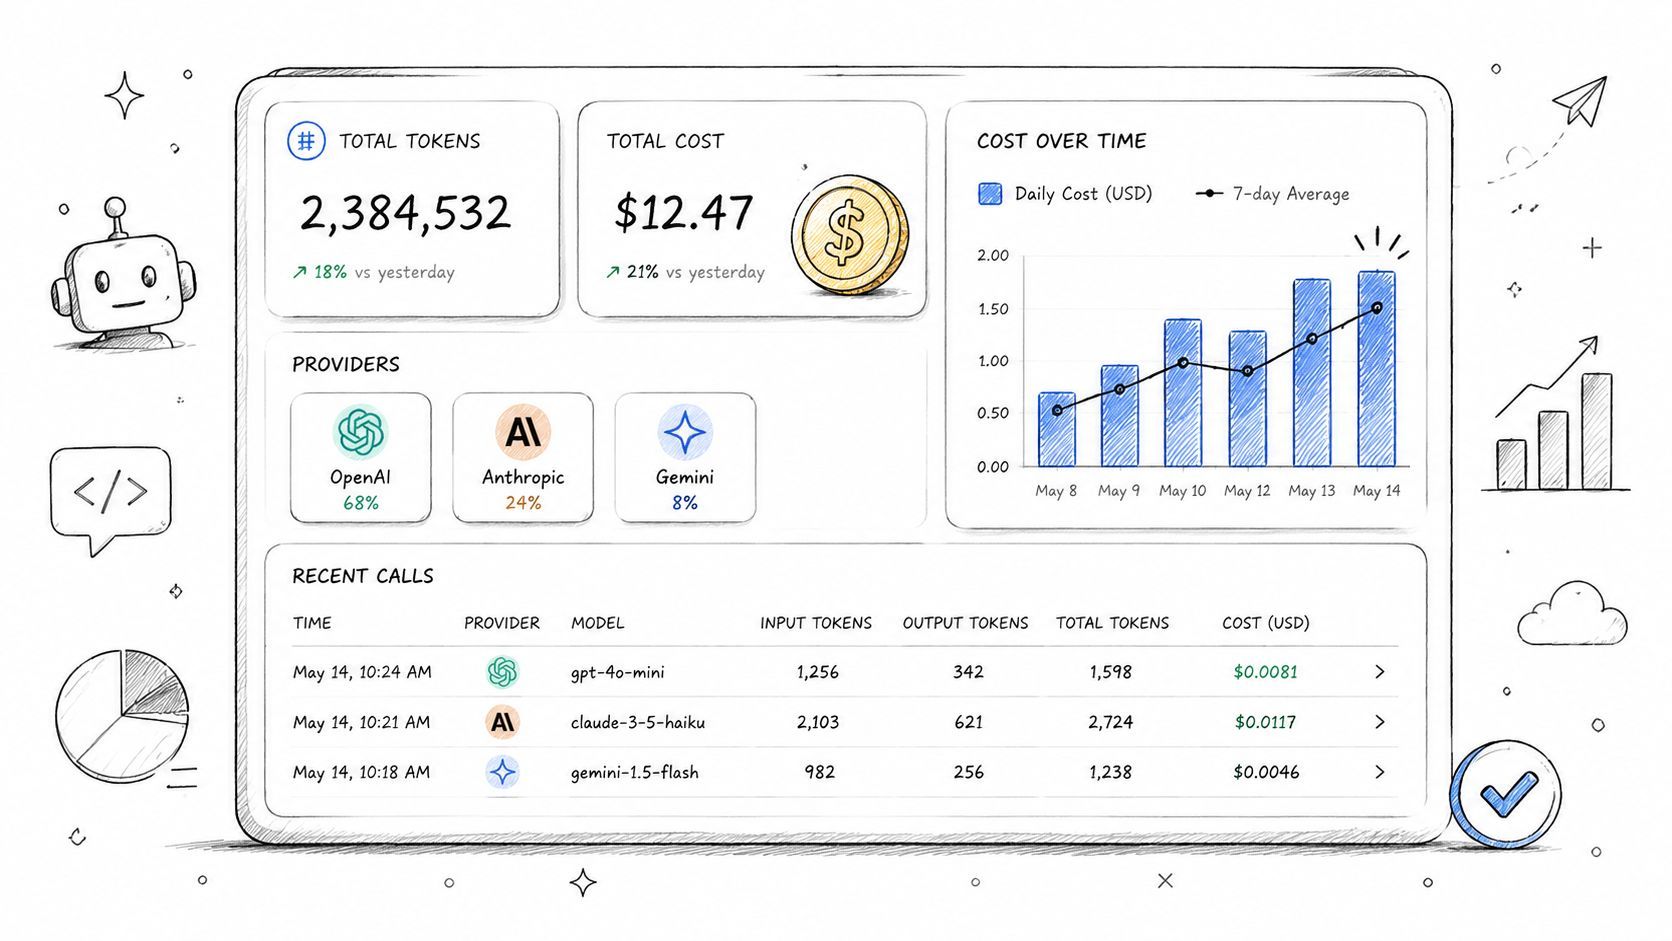
Supagen is a good example of the kind of setup teams want here. It gives teams a centralized dashboard for multi-modal workloads and shows per-call logs with tokens, latency, I/O, and costs across providers like OpenAI, Anthropic, Google, ElevenLabs, and fal.ai. That matters because centralized logs aren't just easier to search. They make debugging agent workflows and cost analysis realistically possible during production incidents.
A few practices work well in real deployments:
- Separate by environment: Production and staging logs should be easy to filter instantly.
- Tag by feature or workflow: “chat”, “summarization”, “voice”, and “agent-run” tags are more useful than generic service names alone.
- Normalize provider fields: Different vendors expose slightly different payloads. Map them to one internal schema before storage.
Centralization also makes machine-assisted alerting practical. Once all events are searchable in one place, unusual patterns stand out faster than they do in scattered raw outputs.
4. Comprehensive Error and Exception Logging
A lot of teams technically “log errors” but still leave themselves blind. They record that something failed, not what failed, where it failed, whether the system recovered, or what the user experienced.
That distinction matters in AI products because not every error is fatal. A provider timeout might trigger a fallback that saves the user session. A malformed response might get repaired by a validator. If you only log the exception, your logs tell half the story.
Log the failure and the recovery path
A useful error log for an LLM call usually includes the provider, model, operation, exception type, sanitized request context, and what happened next. Did you retry? Did you fail over to Anthropic? Did you return a cached result? Did the user get a partial response?
Consider a research agent that calls OpenAI for planning, a search API for retrieval, and Anthropic for synthesis. The user reports “sometimes it just hangs.” Good error logs reveal whether the root cause was a timeout in planning, a parser failure after the final response, or a retry loop that consumed time without surfacing an explicit failure.
What works in practice:
- Include stack traces for real exceptions: They matter for app bugs and parsing failures.
- Log recovery actions: “fallback_triggered”, “retry_scheduled”, and “response_degraded” are often more actionable than the exception itself.
- Add provider context:
provider=anthropicandmodel=...beats a generic “LLM request failed”. - Redact secrets before writing anything: API keys, user identifiers, and raw prompt content need masking.
A timeout without the fallback result is an incomplete incident record.
Severity also matters. Treat provider outages, authentication failures, schema validation breaks, and repeated parsing errors differently. Your team should be able to look at logs and know which failures need immediate action and which ones are expected degradation paths.
5. Performance and Latency Logging
Users don't care whether your system used four elegant sub-steps to answer their question. They care whether it felt fast.
Latency logging needs more detail in AI systems because the total wait time usually comes from several layers. Queueing, retrieval, model time, tool execution, response streaming, and post-processing all add up. If you only log the final duration, you can't optimize anything.
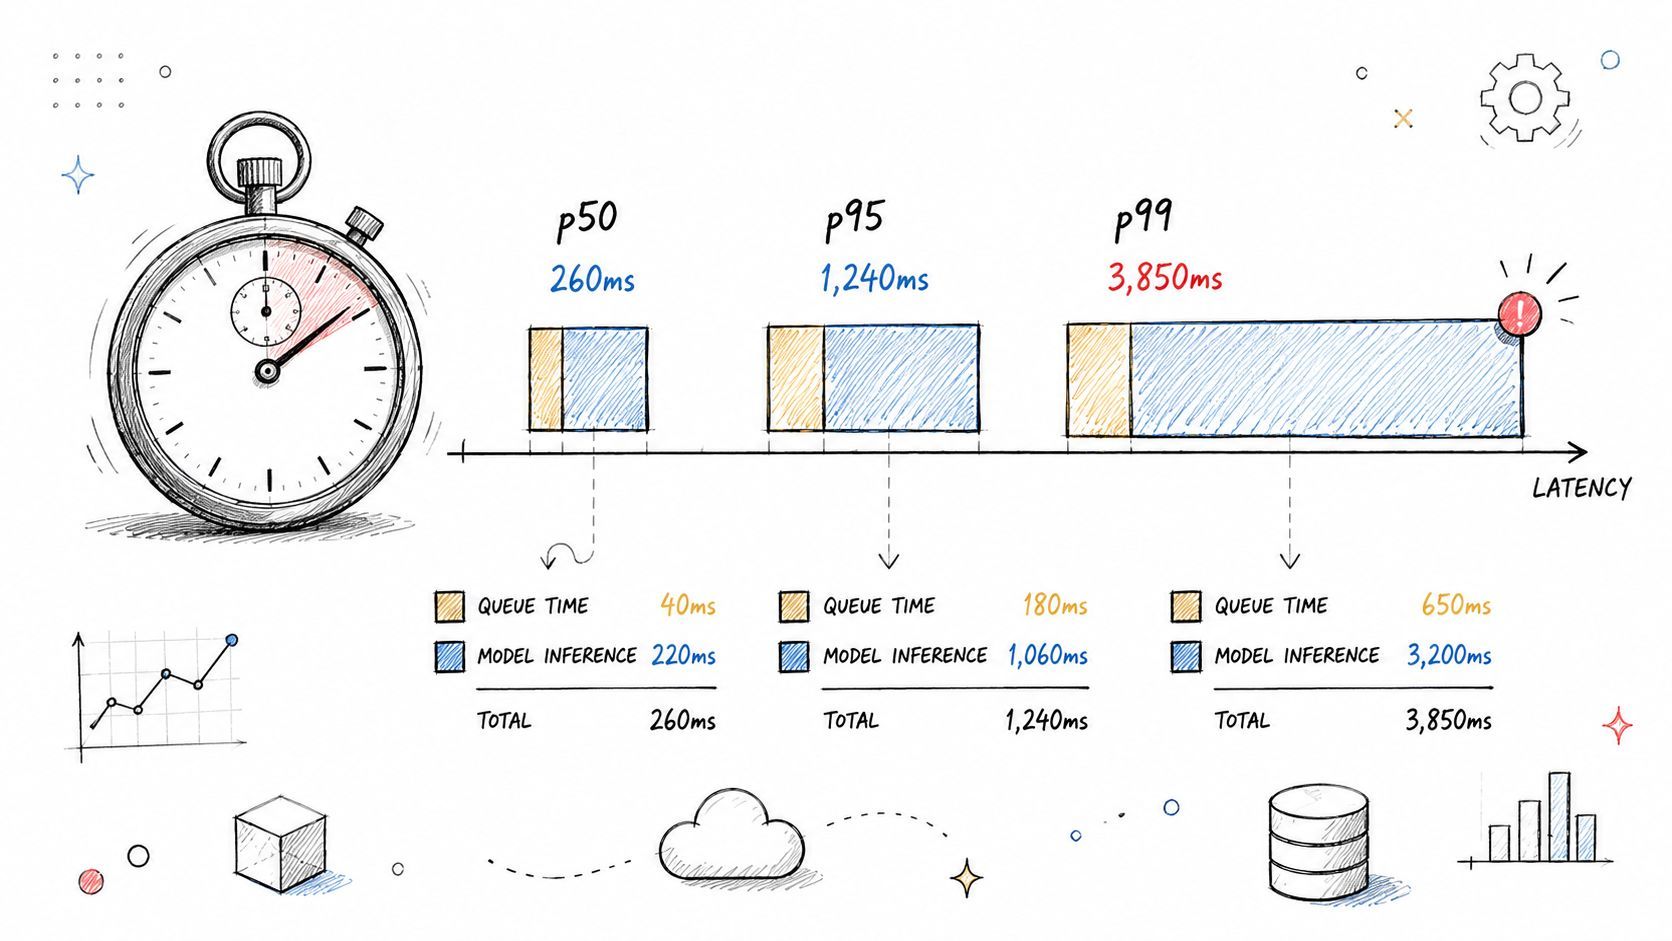
Break latency into useful parts
One of the most practical comparisons in a multi-provider stack is not “Which model is best?” but “Which model is fast enough for this specific workflow?” A real-time chat assistant and an overnight research pipeline shouldn't use the same latency thresholds.
I like to separate timing into at least these buckets:
- Ingress and orchestration time: Request parsing, auth, routing, and setup.
- Provider time: How long OpenAI, Anthropic, Google, or another provider took to respond.
- Validation and formatting time: Schema checks, moderation, and output shaping.
- End-to-end time: What the user waited for.
This also improves fallback logic. If Anthropic isn't failing but is consistently slower for one route, routing logs plus latency logs can justify switching that path to another model. For voice products, the same principle applies to ElevenLabs or other audio services. The bottleneck might not be the model at all. It might be serialization, chunk handling, or downstream playback preparation.
A useful habit is to split successful and failed latency trends. Failed calls often have very different timing behavior, and mixing them with successful requests can hide patterns.
6. Cost and Usage Tracking Logs
In AI products, logging isn't only about correctness. It's also about spend.
Every model call has a cost implication, especially in workflows that chain prompts, retries, and fallback providers. If you don't log usage at the request level, you can't tell whether the expensive part of your system is the primary generation step, a silent retry loop, long prompts, or a feature nobody realized was hitting a premium model.
Treat every model call as a billable event
For AI-native teams, the gap in many logging guides is obvious. They tell you to use structured logs, but they don't explain how to capture token usage, latency, I/O, and per-call costs without storing sensitive prompt text. Dash0 notes that most guides stop at generic structure and privacy advice, while AI systems need logs that balance deep telemetry with masking of actual prompts and user inputs. It also cites a Gartner finding that, in a 2025 study, 68% of AI teams struggle with “observability noise” when standard structured logs fail to contextualize LLM-specific metrics, which delays debugging and spend control, as discussed in Dash0's guide to logging best practices.
In practical terms, cost logs should answer questions like these:
- Which feature burns the most tokens?
- Which provider handles the most expensive fallback path?
- Did a prompt change increase output length?
- Are retries driving spend more than primary calls?
Supagen's dashboard is directly useful here because it exposes per-call logs with tokens, latency, I/O, and costs in one place. That makes cost reviews much more concrete. You can trace spend to a feature, workflow, or prompt version instead of treating the provider invoice like an unsolved mystery.
7. Model and Prompt Version Logging
When someone says, “The assistant got worse last week,” you need more than a hunch. You need to know which prompt template, model version, and parameter set produced the answer.
Many teams fail themselves when they update prompt text in code, tweak temperature, ship a provider change, and leave no clear forensic trail. Once users complain, nobody can reliably reproduce the bad behavior.
Make every output reproducible enough to investigate
For each AI request, log the model name, provider, prompt template identifier, prompt version, and any material configuration such as temperature, tool choice mode, or response format. If your app dynamically selects a model, log why that selection happened too.
A simple scenario makes the value obvious. Your onboarding assistant used one prompt template in staging, another in production, and then began returning weaker answers after a dashboard edit. If the logs include the prompt version and deployment context, you can isolate the exact change. If they don't, the team starts comparing screenshots and guessing.
A few habits make this sustainable:
- Version prompts explicitly: Use a semantic version, revision ID, or immutable hash.
- Log parameter overrides: A tiny configuration change can alter output behavior more than a model swap.
- Tie versions to releases: Prompt version, app deploy, and routing config should be easy to connect later.
If you can't tell which prompt generated an answer, you can't run a serious postmortem.
This is another area where Supagen maps well to real operations. Since it lets teams manage versioned prompts and model routing without hardcoding everything into the app, the logging layer can stay aligned with what was deployed instead of what the codebase used to say.
8. Provider Fallback and Routing Decision Logging
Multi-provider systems look resilient on architecture diagrams. In production, they can become opaque very quickly.
A request may start with OpenAI, fail a policy check, reroute to Anthropic, retry with a smaller context window, and finally return a degraded answer. If your logs only record the final provider, you lose the path that explains both cost and user experience.
Explain why the system chose that model
The best routing logs aren't verbose by accident. They're explicit by design. At the decision point, log the candidate providers, the chosen provider, the reason for the choice, and the result of that decision.
For example, a coding assistant may route simple edits to a cheaper model and complex refactors to a stronger one. That decision should be visible in logs with a reason like route_reason=complexity_threshold or fallback_reason=provider_timeout. The same applies to text-to-speech. If ElevenLabs exceeded your internal threshold and you retried or switched modes, that should be queryable.
Useful fields include:
- Selected provider and model
- Decision reason
- Alternatives considered
- Fallback trigger
- Retry count
- Final outcome
This kind of logging pays off twice. It helps engineering debug strange behaviors, and it helps product teams understand whether routing logic is doing what they intended. A lot of hidden spend comes from fallback paths nobody realized were firing too often.
9. Input Sanitization and Output Validation Logging
AI teams often hear “don't log sensitive data” and then overcorrect by logging almost nothing. That isn't safe observability. It's blindness with good intentions.
The better approach is to log what your guardrails did, not the private content they acted on. You want evidence that sanitization, truncation, prompt injection checks, and schema validation ran. You usually don't need to store the raw user text to get that evidence.
Log guardrails without storing sensitive content
AI workflows frequently process highly sensitive product data, such as user prompts containing names, emails, contracts, health details, financial records, or internal business context. Concurrently, developers require sufficient telemetry to diagnose why a request was blocked, shortened, or rejected.
A practical pattern looks like this:
- Record the action taken:
input_truncated,pii_redacted,schema_validation_failed,injection_pattern_detected. - Store safe summaries: Character count, token estimate, content category, policy result, or template ID.
- Avoid raw content by default: If you must retain excerpts for a tightly controlled workflow, isolate them and apply strict access controls.
- Validate outputs too: Log when a model returned malformed JSON, unsupported tool arguments, or content that failed moderation.
One common example is a structured-output feature that expects valid JSON from OpenAI or Anthropic. When the response fails schema validation, the log should capture the validator result, the schema ID, the provider, and whether the system retried with a repair prompt. That's enough to debug the issue without dumping the entire customer input into your log store.
10. Sampling, Filtering, and Log Level Management
More logs don't automatically mean better logs. In AI systems, over-logging can become its own outage. Storage costs rise, searches slow down, alerts become noisy, and engineers stop trusting what they see.
Rapid7's guidance frames log management as a cost and signal problem. The recommendation is to capture only purposeful fields, apply consistent log levels and timestamps, and enforce rotation and retention policies so logs remain useful without creating runaway expense. The same guidance emphasizes that over-logging increases noise, while filtering, retention limits, and prioritized alerting help keep investigations actionable, as described in Rapid7's log management and analytics best practices.
Keep logs useful without drowning in them
This is especially important for AI products with high request volume or streaming responses. Logging every chunk, every token event, and every success path at full fidelity in production usually isn't worth it. You want complete visibility into failures and enough representative visibility into normal behavior.
A workable policy usually looks like this:
- Always keep errors and warnings: Failures are too important to sample away.
- Sample repetitive success logs: High-volume, low-risk paths can be logged selectively.
- Use stricter production levels: Development can tolerate noisy debug output. Production usually can't.
- Set retention by value: Security logs, billing-relevant usage logs, and audit trails often deserve different retention from generic debug logs.
One pattern I've seen work well is full-fidelity logging for new feature rollouts, then moving to a more selective policy once the workflow stabilizes. When incidents happen, temporarily raise verbosity around a single feature, provider, or correlation ID instead of turning the whole system into a firehose.
10-Point Logging Best Practices Comparison
From Black Box to Control Tower Unifying Your AI Observability
The best practices for logging in AI products aren't separate hygiene tasks. They work as a system.
Structured JSON logs give you a common language. Correlation IDs let you follow one user action across services and providers. Centralized storage puts every relevant event in one searchable place. Error logs explain both the failure and the fallback path. Latency logs reveal where users are waiting. Cost and usage logs tie technical behavior to spend. Version logs make regressions traceable. Routing logs explain why a request took a specific path. Validation logs show where your safeguards intervened. Sampling and retention keep the whole system affordable and usable.
That combination changes how a team works. Instead of reacting to vague reports like “the AI feels weird today,” you can ask focused questions. Which prompt version was live? Which provider handled the traffic? Did latency rise before fallback rates changed? Did output validation fail more often after a routing rule changed? Did retries drive up cost for one feature?
This matters even more in multi-provider stacks. Once you combine OpenAI, Anthropic, Google, ElevenLabs, and specialized tools, debugging stops being about one API response. It becomes about the behavior of an orchestration layer. If that layer isn't observable, the product becomes unpredictable.
A unified platform helps because it removes a lot of the plumbing work. Supagen is built around problems AI teams encounter in production: versioned prompts, model routing across providers, centralized observability, and cost visibility. Its dashboard surfaces per-call logs with tokens, latency, I/O, and costs, which means your team can inspect what happened without stitching together ad hoc tooling. For teams shipping chatbots, generation tools, analysis products, or agent workflows, that reduction in observability friction is a real operational advantage.
The deeper lesson is simple. Logging for AI isn't just about keeping records. It's about maintaining control. Good logs let engineers debug faster, product teams understand behavior, and founders see whether a feature is sustainable to operate. Poor logs force everyone to guess.
If your current setup still depends on scattered console output and provider dashboards, start with the basics and make them consistent. Move to structured logs. Add correlation IDs. Centralize everything. Then layer in the AI-specific details that generic logging advice often skips: tokens, per-call cost, model choice, prompt version, fallback reason, validation status, and redaction-aware telemetry.
That's how you turn an AI feature from a black box into a system you can run.
Supagen gives you the production layer most AI teams end up rebuilding the hard way. With Supagen, you can manage versioned prompts, route across providers like OpenAI, Anthropic, Google, ElevenLabs, and fal.ai, and inspect centralized per-call logs for tokens, latency, I/O, and costs from one dashboard. If you're shipping AI features fast and want better debugging, cost visibility, and control without hardcoding observability into your app, it's a strong place to start.