API Rate Limit Exceeded: A Developer's Guide to a Fix

Your deploy looked fine in staging. Then production traffic hit, an integration started looping, and now your logs are full of API rate limit exceeded. Users are seeing failures, your queue is backing up, and your first instinct is to smash retry and hope it clears.
Slow down.
This error usually isn't random, and it usually isn't solved by adding more retries. It's a control mechanism. API providers use rate limits to protect shared infrastructure, contain abuse, and keep service quality predictable. When you hit one, the fix starts with finding who is consuming the budget, then making the client behave better, then tightening the system so the same mistake doesn't wake you up again.
Most articles stop at exponential backoff. That's useful, but it misses two places where teams keep getting burned: hidden traffic sources like CI jobs and webhooks, and the platform layer where routing, observability, and fallback behavior decide whether a limit becomes a blip or an outage.
Table of Contents
- So You Have Hit a Wall Called Rate Limiting
- First Responders Diagnosing the Source of the Surge
- The Client-Side Fix Implementing Smart Retries and Backoff
- Building Resilience with Routing Fallbacks and Observability
- Playing the Long Game Server-Side Strategies and Proactive Monitoring
- From Rate-Limited to Rate-Confident
So You Have Hit a Wall Called Rate Limiting
It usually starts the same way. A deploy goes out, a worker starts looping, or a webhook fan-out gets away from you. Then the logs fill with API rate limit exceeded, users start seeing failures, and everyone assumes the provider is down.
In practice, this message usually means your system sent traffic faster than the API contract allows. The standard response code for that condition is HTTP 429 Too Many Requests, defined in RFC 6585. Some providers throttle in less apparent ways, but 429 is the clearest signal that your request volume, concurrency, or burst pattern crossed a boundary.
That framing matters. Treating rate limiting like a random application bug leads to the wrong fix. This is an operational constraint. You are working inside a budget, and something in your stack just spent it.
The first thing to remember
Rate limits exist to keep shared systems stable and predictable. Providers use them to protect capacity, isolate abusive traffic, and keep one customer spike from degrading service for everyone else. On your side, the practical takeaway is simple. If one fast loop can burn through the quota, the system needs traffic control, not just cleaner code.
GitHub makes this concrete because it publishes real limits. Its REST API rate limit documentation shows different budgets for unauthenticated requests, authenticated users, and some enterprise or app-based scenarios. It also documents separate limits for concurrency and point-based secondary controls. The important lesson is broader than GitHub itself. Modern APIs rarely enforce a single flat cap. They often combine hourly quotas, burst controls, and concurrency thresholds.
That is why retry logic alone does not solve the whole problem.
A rate-limit incident usually has more than one cause. The obvious client may be retrying too aggressively, but hidden traffic often causes the primary damage. CI jobs, preview deployments, background syncs, webhooks, and third-party integrations can all drain the same quota pool without showing up in the path you were staring at. Consequently, teams get stuck. They patch the frontend retry loop and miss the worker, the build pipeline, or the routing layer that keeps hammering the same provider.
The fix usually happens in three layers:
- Contain the spike: stop the loop, pause the worker, disable the noisy webhook, or gate the job that is flooding the upstream API.
- Repair the client behavior: respect provider headers, back off correctly, smooth bursts, and cache or batch requests where possible.
- Control the system around it: add request-level observability, separate traffic sources, and route or shed traffic before one source burns the whole budget.
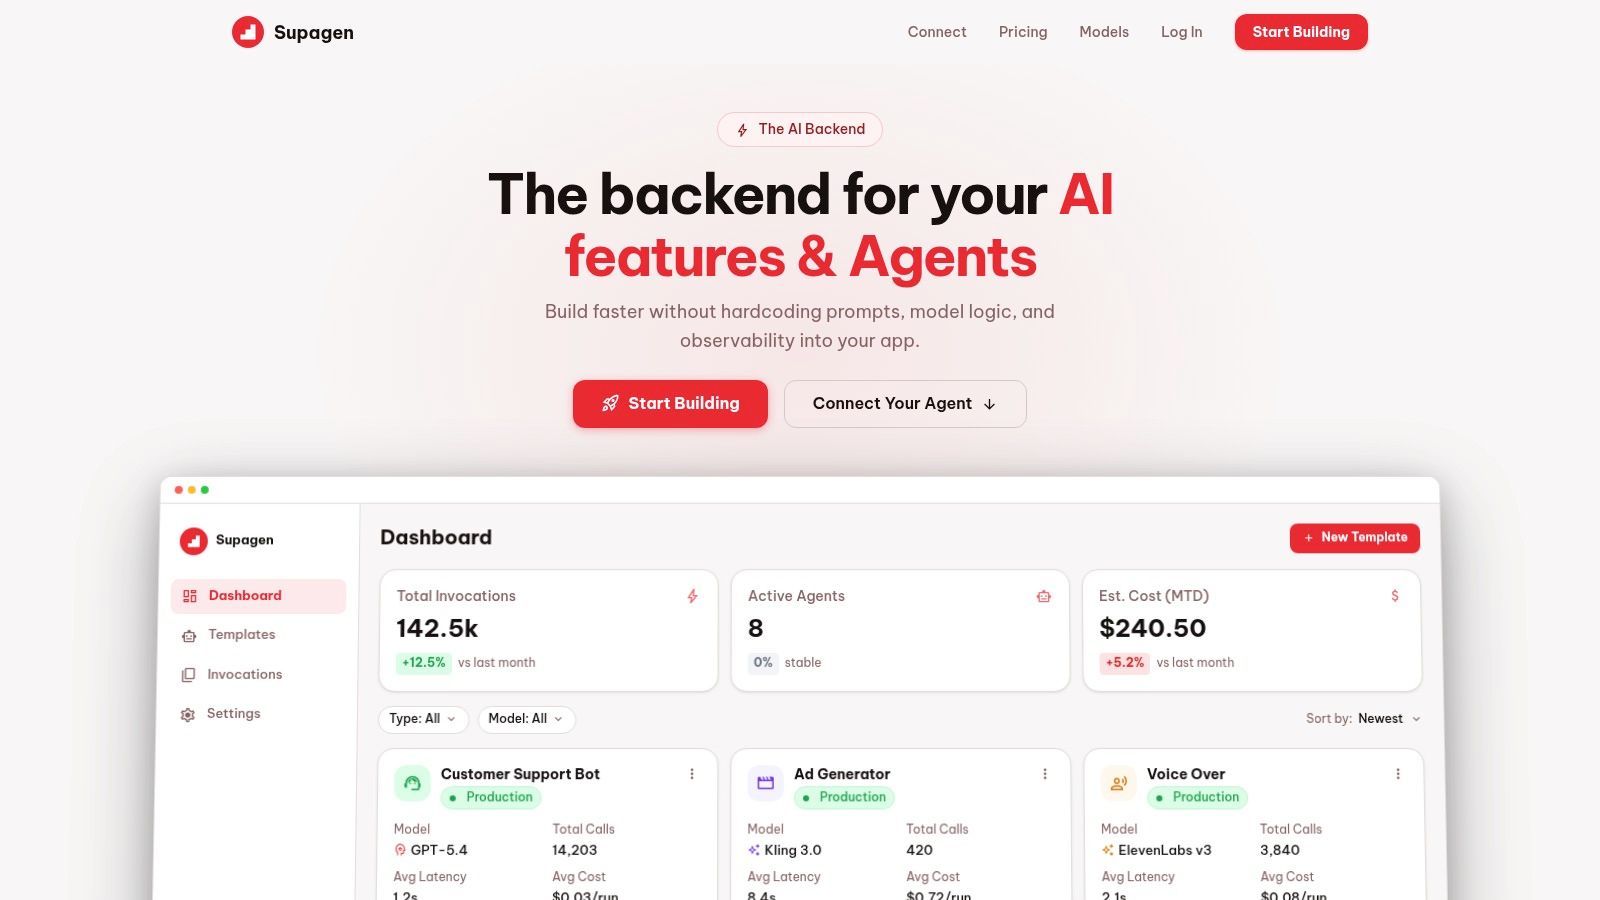
That middle layer gets most of the attention in rate-limit guides. It matters, but it is only one part of the recovery. Stable systems combine careful client behavior with visibility into hidden consumers and, when the architecture calls for it, routing and fallback controls through an API gateway or orchestration layer such as Supagen. Then you can see who is spending the budget, decide where traffic should go, and keep one mistake from turning into a full outage.
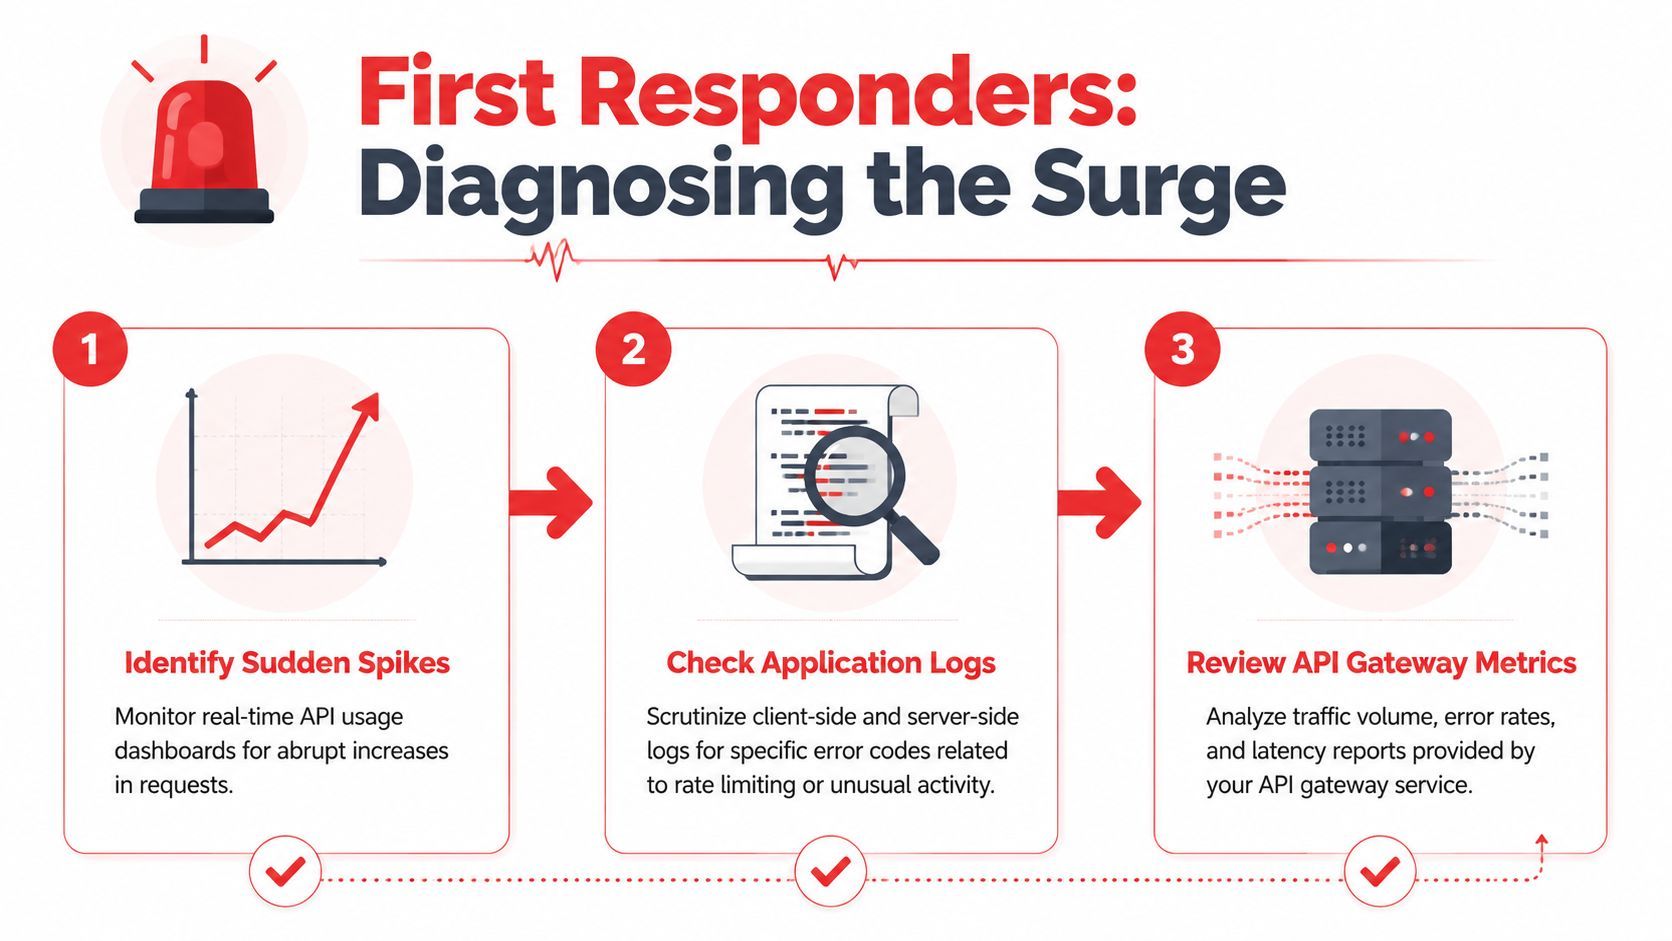
First Responders Diagnosing the Source of the Surge
The first job is not writing better retry code. The first job is finding out who is burning through the quota right now.
Teams lose time here because they inspect the request path that just failed and ignore the traffic they do not see in the product UI. A webhook retry loop, a preview deploy, a queue worker with too much parallelism, or a third-party integration can empty the same bucket as your app. If you only inspect the frontend, you can fix the wrong thing and keep getting 429s.
Start with the response headers
Rate-limit incidents are easier to diagnose when the provider tells you how it measures usage. Read the response headers before changing application code or scaling infrastructure.
Look for these signals:
Retry-Aftertells the client how long to wait before trying again.X-RateLimit-Limitshows the quota for the current window.X-RateLimit-Remainingshows how much budget is left.X-RateLimit-Resetshows when the current window resets.
Those headers help you separate a short burst from a sustained drain. They also help you answer a more important question. Did one consumer spike, or did several quiet consumers add up over time?
Look beyond your main app
A rate-limit incident often starts outside the code path everyone is watching. The app looks calm. Traffic from users has not changed much. The quota still disappears.
GitHub community guidance on sudden rate-limit exhaustion tells users to inspect authorized apps, webhooks, GitHub Actions workflows, and misconfigured clients like Sourcetree in this GitHub Community discussion about sudden rate-limit exhaustion. The culprit is often indirect traffic.
Check these before blaming your primary request flow:
- CI and CD pipelines: test runs, deployment checks, and preview builds can hit an upstream API far harder than normal user traffic.
- Webhooks: failed acknowledgments can trigger retries and create loops between systems.
- Third-party apps: connected tools may poll aggressively or duplicate requests without making that obvious in your own dashboards.
- Batch jobs: one sync job is manageable. Two overlapping runs can exhaust a shared quota fast.
- Background workers: queue consumers can fan out requests in parallel and turn a small backlog into a surge.
- Proxy or shared-IP behavior: some providers enforce limits per token, some per account, some per IP. If you guess wrong, your mental model breaks.
Hidden traffic is still your traffic. If it shares the same budget, it shares the same blast radius.
This is also the point where observability stops being a nice-to-have. Good logs and request tagging let you split traffic by API key, service account, worker type, endpoint, and environment. If you run traffic through a gateway or orchestration layer such as Supagen, route-level metrics and per-consumer visibility make this much faster. You can see whether production users, CI, a webhook consumer, or a background sync is spending the budget, then contain the right source instead of throttling everything blindly.
Treat it like an incident
Handle an API rate limit exceeded alert the same way you would handle a production incident. Work a short checklist and stop the amplification first.
- Identify the caller. Find the API key, service account, user, worker, webhook, or integration generating the surge.
- Identify the endpoint. Some endpoints are cheap. Others fan out, trigger secondary calls, or consume a stricter quota bucket.
- Identify the time window. Correlate the spike with deploys, cron schedules, queue growth, webhook failures, or CI runs.
- Compare real traffic to the provider contract. Use published limits and your logs, not memory or assumptions.
- Pause the noisy path. Disable the loop, pause the worker, mute the webhook, or gate the pipeline before you start tuning code.
A useful rule in practice is to inspect logs and dashboards by caller, endpoint, and time window, then compare that activity against the provider's documented limits. Set alerts before the hard cutoff so the team has time to intervene. Waiting until every request returns 429 means the diagnosis starts late and recovery gets much messier.
The Client-Side Fix Implementing Smart Retries and Backoff
The worst fix is the most tempting one. A request fails, so the client retries immediately. Then it fails again, and retries again, and now you've built a traffic multiplier on top of an already throttled system.
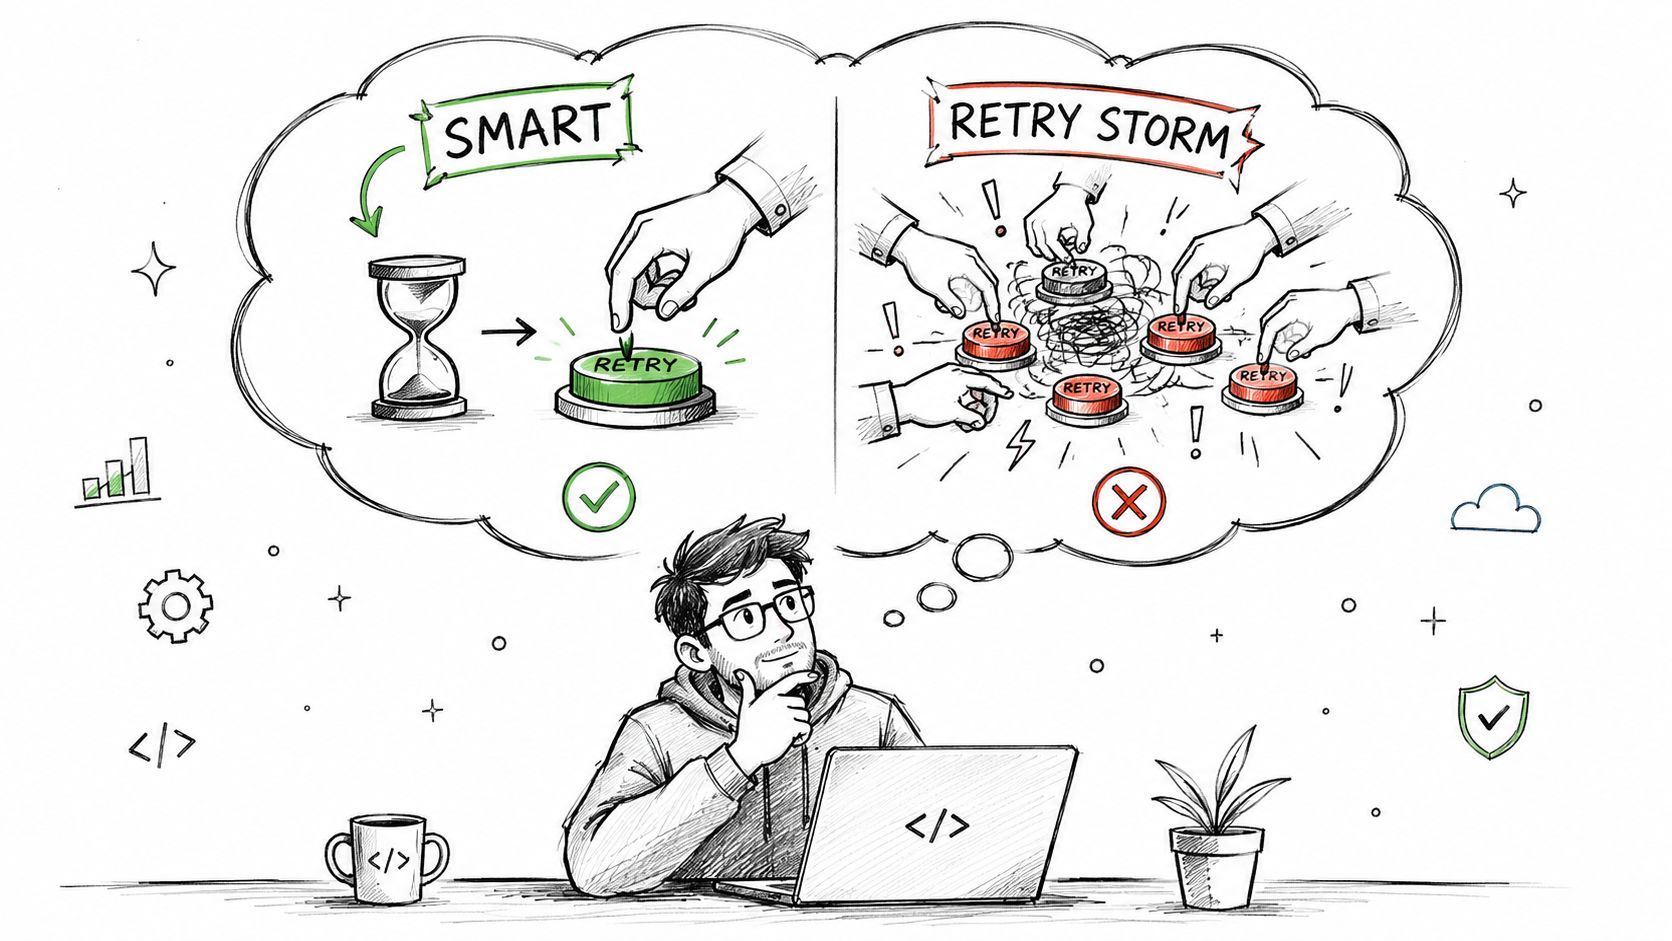
What not to do
Don't do any of this:
- Immediate retries: they create retry amplification and worsen throttling.
- Infinite loops: they turn a temporary rejection into a sustained outage.
- Synchronized retries across workers: every client wakes up at the same moment and collides again.
- Ignoring server instructions: if the provider sends
Retry-After, your client shouldn't invent a different schedule.
Autodesk documents that exceeding an endpoint's published limit returns HTTP 429 and that the Retry-After header specifies how many seconds to wait before retrying, which makes it the safest signal for automated logic. Microsoft's Azure guidance also notes that limits can be affected by token bursts, not just raw request counts, in this Microsoft discussion of assistants API rate-limit handling.
The retry pattern that actually works
A solid client combines three behaviors:
- Respect
Retry-Afterfirst - Use exponential backoff when the server doesn't give precise timing
- Smooth request bursts instead of firing everything at once
Caching belongs in this list too. The cheapest API call is the one you never send.
If a response can be reused safely, cache it. Backoff helps after you hit the wall. Caching helps you avoid driving into it.
Common API Rate-Limit Response Headers
A short explainer helps if you're teaching this pattern to a team:
JavaScript example
This is the shape I want in a production client. It respects Retry-After, falls back to exponential backoff with jitter, and stops after a bounded number of attempts.
async function sleep(ms) {
  return new Promise(resolve => setTimeout(resolve, ms));
}

function parseRetryAfter(headerValue) {
  if (!headerValue) return null;

  const seconds = Number.parseInt(headerValue, 10);
  if (!Number.isNaN(seconds)) return Math.max(0, seconds * 1000);

  const dateMs = Date.parse(headerValue);
  if (!Number.isNaN(dateMs)) return Math.max(0, dateMs - Date.now());

  return null;
}

async function fetchWithRateLimitHandling(url, options = {}, maxRetries = 5) {
  let attempt = 0;
  let baseDelay = 1000;

  while (true) {
    const response = await fetch(url, options);

    if (response.status !== 429) {
      return response;
    }

    if (attempt >= maxRetries) {
      throw new Error("Rate limit persisted after bounded retries");
    }

    const retryAfterMs = parseRetryAfter(response.headers.get("Retry-After"));
    const jitterMs = Math.floor(Math.random() * 250);
    const backoffMs = baseDelay * Math.pow(2, attempt) + jitterMs;
    const waitMs = retryAfterMs ?? backoffMs;

    await sleep(waitMs);
    attempt += 1;
  }
}
A few implementation notes matter more than the syntax:
- Bound the retries. Some failures need human intervention.
- Add jitter. Without randomness, multiple workers retry in lockstep.
- Queue or batch outbound calls. Don't let every component fire independently.
- Reduce payload cost when possible. In AI workloads, lowering
max_tokens, batching work, and spreading jobs gradually can reduce throttling pressure, as noted in the Microsoft guidance linked above.
Building Resilience with Routing Fallbacks and Observability
The ugly version of this incident usually looks the same. The client retries, the worker retries, the webhook consumer retries, and your provider starts returning 429s everywhere at once. At that point, retry code is no longer the main problem. You have a traffic coordination problem.
Teams often stop at client-side backoff because it is the fastest fix. It is still only one layer. Once requests come from several services, scheduled jobs, CI pipelines, and third-party webhooks, you need one place that shows the full request path, the current pressure on each upstream, and the policy for what happens when one route starts failing.
That is the job of the routing layer.
Why retries are not enough once the system grows
Retry code inside each service hides the shape of the surge. One frontend flow may be harmless on its own, but combined with a background sync and a webhook replay storm, it can exhaust the same provider quota in minutes. If every caller handles throttling independently, nobody has a clean answer to three questions that matter during an incident:
- Which caller is driving the spike
- Which endpoint, model, or tenant is consuming the budget
- Which fallback action reduced failures instead of shifting them elsewhere
I have seen teams blame end-user traffic when the underlying source was a nightly job and a misconfigured webhook retry policy. The fix was not another exponential backoff wrapper. The fix was visibility across all traffic sources and a single place to control routing.
What observability should show during a 429 event
Good observability helps you separate symptom from cause. A chart of 429 counts is only the starting point. You also need request logs and traces that let you filter by caller, tenant, endpoint, model, and time window.
That makes it possible to answer practical questions fast:
- Did the spike come from interactive user traffic or background automation
- Was the surge bursty, sustained, or caused by retries stacking on retries
- Did one provider degrade first, or did a single workflow fan out too aggressively
- Did the fallback path protect users, or did it just push load onto a second provider
This matters for AI workloads in particular. Ten requests are not always equal. A small classification call and a long generation with high token output do very different things to latency, cost, and provider quota. Counting requests helps. Seeing request weight helps you make the right routing decision.
A dashboard should help an on-call engineer answer, "what do I turn down, queue, reroute, or disable right now?"
Routing policies that fail gracefully
A routing layer gives you options that application-level retry code cannot manage cleanly by itself. If one provider starts rate-limiting a premium model, you can route low-priority traffic to a cheaper or less-congested model, queue non-urgent work, or return a degraded response that keeps the user flow alive.
Tools such as Supagen are useful here because they combine observability with request routing. You can see which upstream is saturating, compare error rates across providers, and change policies without touching every service that makes API calls. That reduces two common failure modes. The first is hardcoded provider logic spread across the codebase. The second is slow incident response because every change requires a redeploy.
The trade-off is straightforward. Fallbacks improve availability, but they can change output quality, latency, and cost. Routing a request to a smaller model may keep the app responsive while reducing answer quality. Queueing work protects your quota but delays completion. A mature setup makes those trade-offs explicit per workload instead of treating every request the same.
Hidden traffic sources deserve first-class visibility
The traffic that trips a limit is not always user-facing. CI jobs that run integration tests against real APIs, webhook redeliveries, backfills, admin scripts, and cron tasks can consume the same shared quota as production traffic in the background. If your dashboards only break down requests by app server, you miss the source that truly matters.
Track those callers separately. Tag requests by environment, service, tenant, and job type. Put guardrails around anything automated. Rate limiting becomes much easier to manage when you can say, with confidence, "production user traffic is healthy, but webhook replay is flooding provider B, so we are queueing that path for an hour."
That is the shift from reactive retry logic to operational control.
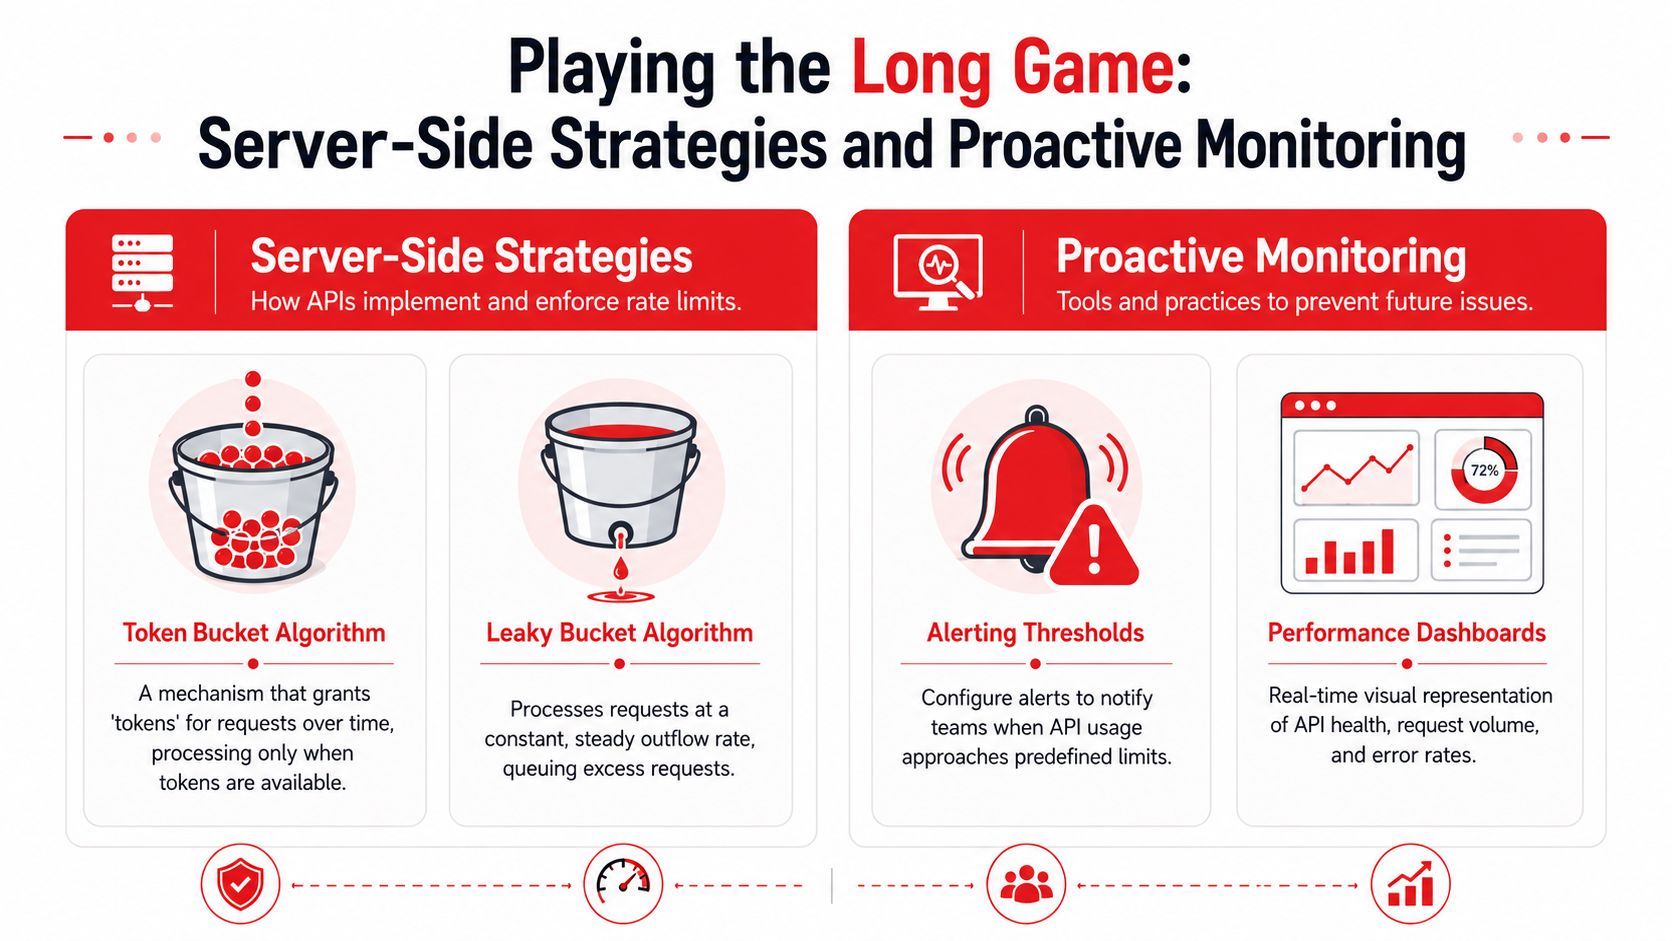
Playing the Long Game Server-Side Strategies and Proactive Monitoring
The worst rate-limit incidents are not caused by one bad retry loop. They come from a system that has no opinion about which traffic should win when quota gets tight.
Why providers enforce limits differently
Providers are protecting different failure points, so they shape traffic in different ways.
A token bucket model permits short bursts, then slows clients once that budget is spent. That fits user-driven products where a person may click fast for a few seconds and then stop. A leaky bucket model keeps requests flowing at a steadier pace, which is safer for backends that degrade under spikes. Fixed and sliding windows show up for the same reason. They are ways to decide whether the provider cares more about burst control, sustained throughput, or fairness across tenants.
You do not need to memorize the algorithm names. You need to read the behavior correctly. If a provider tolerates bursts, batch work may succeed if you spread it out. If a provider enforces a flatter request shape, your queue and scheduler matter more than your retry code.
The shift toward cost-aware controls
Simple request counting works until one API call stops meaning one unit of work.
That is common in AI systems. One request may be a short text completion. The next may include a large prompt, tool execution, retrieval, or image generation. Treating those as equal is easy to implement and hard to operate.
Some platforms are moving toward limits based on estimated cost, model class, or token usage instead of plain request count. That changes how you should design your own server-side controls. Per-user request caps still help, but they are not enough for expensive workloads. Put expensive paths behind queues. Reserve budget for interactive traffic. Split quotas by workload class so a backfill job cannot consume the same pool your production app needs to stay responsive.
This is also where routing tools such as Supagen help. Client-side retries answer the question, "what should this caller do after a rejection?" Routing and policy control answer a different question, "which requests should reach this provider at all, and under what conditions?" That distinction matters in real incidents.
Server-side controls that prevent repeat incidents
A stable system makes quota a scheduling problem, not an emergency.
Use admission control at the edge. Reject or defer low-priority work before it competes with user-facing requests. Add per-tenant and per-job-type quotas so one noisy customer, import job, or webhook replay cannot drain a shared allowance. Queue background work and release it at a controlled rate instead of letting every worker fire at once.
Caching helps here too, but only when you apply it deliberately. Cache repeat reads, repeated prompts, and lookup-heavy operations that hit the same upstream inputs. Do not cache blindly and serve stale results where freshness matters. The trade-off is simple. Every cache hit saves quota, but every cache layer adds invalidation rules and failure modes of its own.
What to monitor on your side
If you only watch aggregate request volume, you will miss the reason you got paged.
Track the signals that tell you who is burning quota, how fast, and whether the pressure is temporary or structural:
- Requests rejected or delayed by your own admission controls
- Quota burn rate by provider, endpoint, model, and environment
- Top consumers by tenant, worker, webhook source, and CI job
- Queue depth and time-to-drain for deferred work
- Cache hit rate on the paths that protect upstream quota
- Rate-limit response headers and reset timing from each provider
Those metrics are more useful when they drive action. Alert on unusual burn rate before you hit the hard cap. Route lower-priority traffic to a cheaper or less-constrained path when saturation starts. Pause non-production callers automatically if they cross a threshold. During incidents, that kind of policy control is often the difference between a degraded feature and a full outage.
Teams get into trouble when they treat rate limiting as a client concern only. The safer approach is layered. Clients should back off and respect server signals. Your platform should decide which traffic is allowed through, which traffic waits, and which traffic gets rerouted or dropped. That is how you stop one bad loop, one replay storm, or one careless CI job from taking the whole quota with it.
From Rate-Limited to Rate-Confident
At 2 a.m., "API rate limit exceeded" feels like a broken system. By the next incident, it should feel like a signal. Something in your stack is producing traffic faster than the provider is willing to serve it, and now you know exactly where your design needs work.
The fix is rarely just "add retries." Retries help only when the caller is otherwise well-behaved. If the source is a webhook replay, a batch worker with no concurrency cap, or a CI job hammering a staging key that shares quota with production, retries make the spike worse.
Teams that recover well treat rate limits as part of normal operations. They know which traffic is user-facing and which can wait. They can tell whether the surge came from the app, a background job, a deployment pipeline, or an external event source. They also have one place to see quota burn, routing decisions, fallback behavior, and failures, instead of guessing from scattered logs during an incident.
That shift matters. A rate limit is not only a client problem. It is a traffic management problem across clients, servers, queues, schedulers, webhooks, and observability.
If you remember one rule, make it this one. Protect quota at multiple layers. Teach clients to back off. Put server-side controls in front of expensive upstream calls. Watch hidden traffic sources as closely as user requests. That is how a noisy loop turns into a contained incident instead of a full outage.
If you're building AI features and want fewer hardcoded retries, clearer logs, and saner routing when providers start throttling, Supagen gives you a production layer for prompt management, model routing, observability, fallbacks, and cost tracking through a single integration. It's a practical way to ship faster without burying rate-limit logic across your app.