10 Best AI Observability Tools for 2026
Your LLM app shipped. Users are hitting it. Then production starts behaving nothing like staging.
A prompt chain that looked stable in test starts failing only for a certain customer segment. Retrieval quality drops, but no traditional alert fires because the vector store is up and the API is returning 200s. Latency climbs even though infrastructure metrics look normal. Cost rises because a fallback path is looping more often than expected. If prompt inputs, outputs, tool calls, token usage, routing decisions, and failures live in different systems, root cause analysis turns into guesswork.
That is why AI observability tools are now part of the production stack for serious LLM teams. The market for AI observability tools is growing quickly, but the more important signal is operational. AI failures rarely sit in one layer. They cut across prompts, retrieval, orchestration, model providers, and application logic. Centralizing that visibility changes how fast a team can detect regressions, explain bad outputs, and control spend.
The tooling has improved fast. Choosing well is still hard.
Some products are strongest as a unified backend that combines tracing, logging, evaluations, analytics, and cost visibility in one system. Others fit better as point solutions that do one job well, such as prompt tracing, gateway controls, or model quality analysis, and plug into a broader stack. That trade-off matters more than feature checklists suggest. A team with one LLM app and a small platform footprint may move faster with an integrated system like Supagen. A larger organization with Datadog, custom pipelines, and strict governance may get better results by assembling multiple tools on purpose.
This guide takes the second question seriously. It does not just rank 10 AI observability tools. It also gives you a practical way to evaluate them and decide whether you need one backend or a set of specialized components that fit your existing architecture.
Table of Contents
- 1. Supagen
- 2. LangSmith by LangChain
- 3. Arize Phoenix open-source by Arize AI
- 4. Weights & Biases Weave
- 5. Langfuse
- 6. Helicone
- 7. Galileo
- 8. Fiddler AI
- 9. TruEra
- 10. Datadog LLM Observability
- Top 10 AI Observability Tools, Feature Comparison
- Making the Right Choice for Your AI Stack
1. Supagen
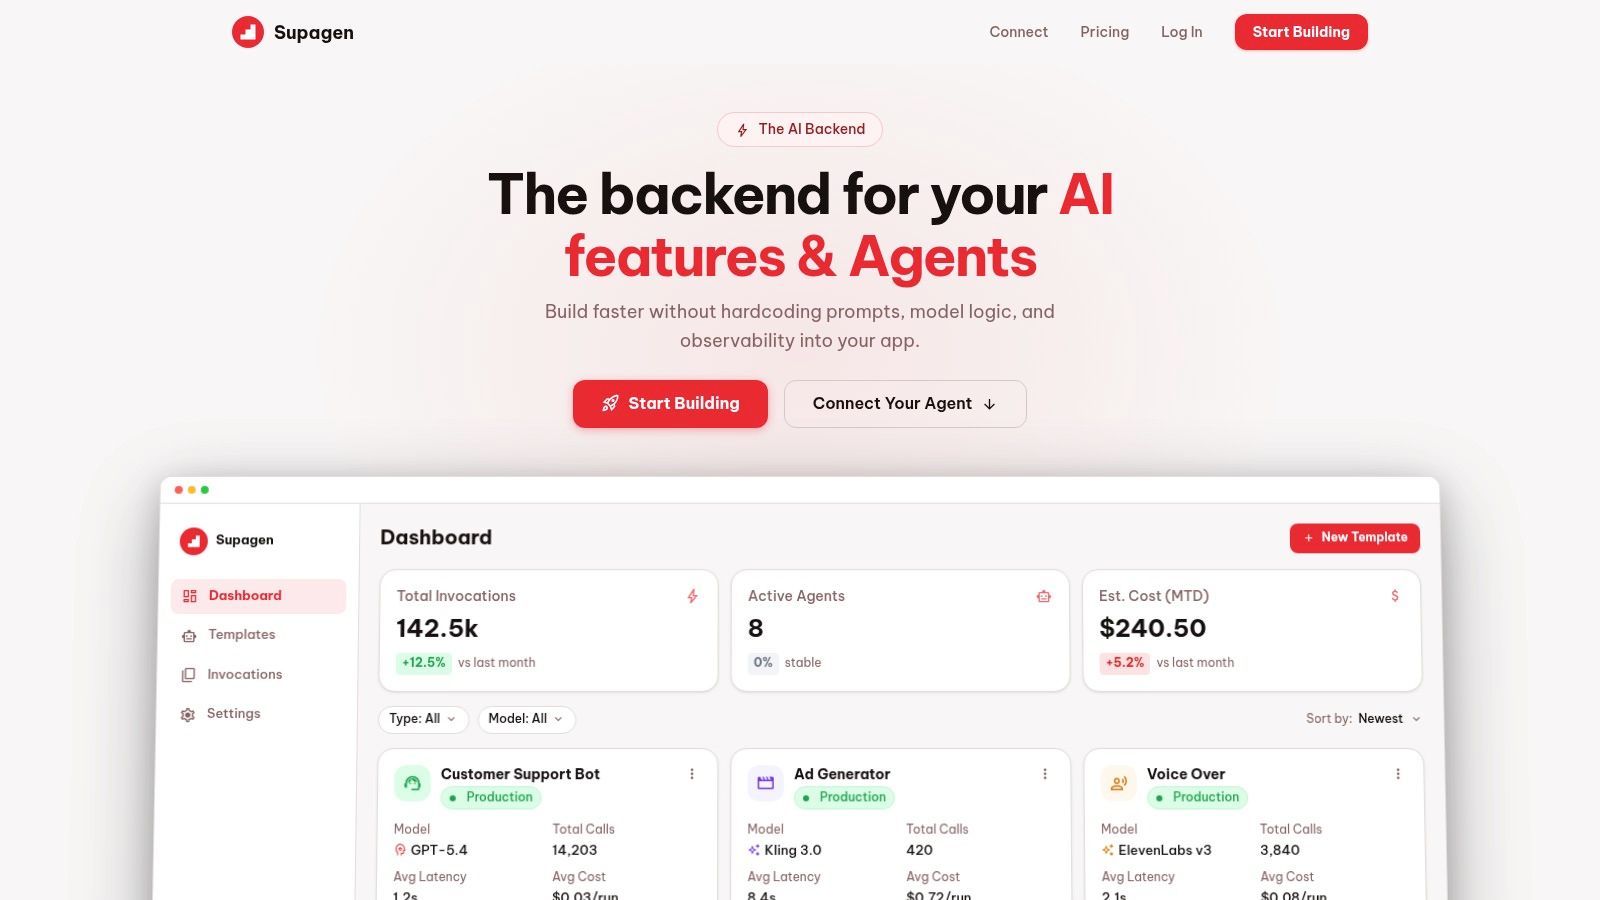
Supagen takes a different approach from most AI observability tools. Instead of acting only as a tracing layer, it serves as the production backend where prompts, routing, observability, and cost tracking live together. That matters because a lot of AI incidents aren't isolated monitoring problems. They're workflow problems caused by hardcoded prompts, scattered provider logic, and no clean way to change behavior without shipping code.
Why Supagen stands out
Supagen centralizes versioned prompt management, model configuration, provider switching, and per-call logs in one dashboard. For teams building fast, that's usually more useful than wiring together separate prompt tools, logging tools, and evaluation tools and then trying to keep them consistent. You can inspect tokens, latency, I/O, and cost at the call level, then change prompt behavior or routing from the dashboard instead of waiting for another redeploy.
It also handles multi-provider and multi-modal workloads well. If you're switching between providers for quality, latency, geography, or fallback reasons, that routing logic doesn't need to stay buried in app code. Supagen supports text, image, video, audio, and JSON workflows, which makes it more practical than observability products that feel LLM-text-only.
Practical rule: If your team keeps saying "we'll just patch the prompt in code one more time," you probably need a unified backend more than another standalone trace viewer.
A second strength is accessibility. Supagen is clearly built for startup product teams, indie hackers, and non-technical founders who need production visibility without a long instrumentation project. MCP-compatible agents can connect through a simple URL with OAuth, so teams don't have to build a lot of custom plumbing just to get agents under control.
Where Supagen fits best
Supagen is a strong choice when speed matters more than assembling a bespoke stack. It's also one of the better fits for the underserved zero-code and low-config segment, where most enterprise-first tools are too heavy. Coverage of that audience is still thin across the market, which is part of why unified backends stand out for indie builders and small teams, as noted in LangChain's roundup of LLM observability tools.
What works well:
- Single integration point: Prompts, routing, observability, and cost tracking sit behind one backend.
- Fast iteration: Versioned prompts and a visual editor reduce the need for repeated releases.
- Useful agent support: MCP connectivity with OAuth is simpler than many SDK-heavy setups.
Trade-offs:
- Pricing transparency: It's free to start, but public enterprise pricing details aren't listed.
- Backend dependency: You should still evaluate governance, security, and operational dependency before centralizing too much in one vendor.
For teams choosing between "buy one platform" and "assemble five tools," Supagen is the clearest example in this list of the unified-backend path.
2. LangSmith by LangChain
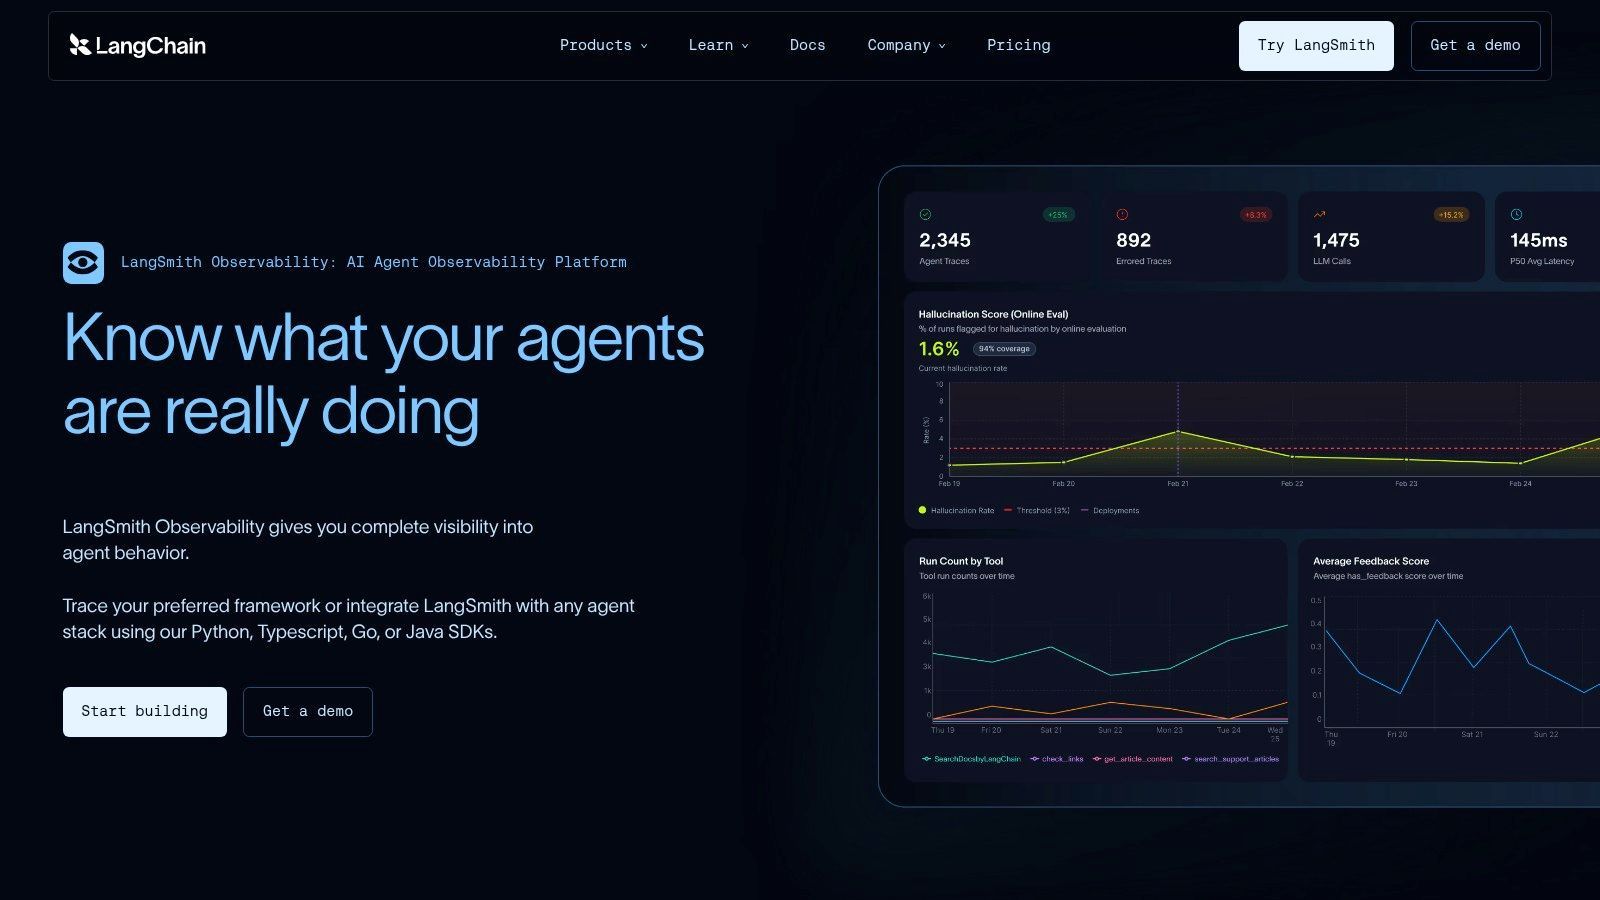
LangSmith is the fastest path to visibility if your app already runs on LangChain or LangGraph. That's the main buying reason. You get hierarchical traces for chains, tools, and agents without fighting your stack, and the evaluation workflow feels connected to the runtime data instead of bolted on later.
Best for LangChain native teams
LangSmith is strongest when your developers are already thinking in LangChain abstractions. Traces map naturally to the code structure, and dataset-based evaluations make it easier to compare prompt or chain changes before they go wide. The feedback loop is good for teams iterating on agent behavior, especially when the problem isn't "did the API fail" but "did the agent make the wrong decision three steps earlier."
The downside is just as clear. Outside the LangChain ecosystem, the product loses some of its advantage. You can still use it, but it doesn't feel as inevitable. Teams building with custom orchestration or framework-agnostic pipelines may prefer tools that start with OpenTelemetry or raw traces rather than framework-native concepts.
LangSmith makes sense when LangChain is already your application skeleton. If LangChain isn't core to your architecture, evaluate it more skeptically.
What I like:
- Trace depth: Good visibility into nested tool and agent execution.
- Eval workflow: Dataset and scoring flows are more mature than many observability-first products.
- Monitoring tie-in: Quality, latency, cost, and regression checks can live in one workflow.
What I'd watch:
- Ecosystem gravity: The best parts assume LangChain or LangGraph usage.
- SaaS posture: Teams that need strict self-hosting will likely look elsewhere.
This is a very good product. It's just a very opinionated one.
3. Arize Phoenix open-source by Arize AI
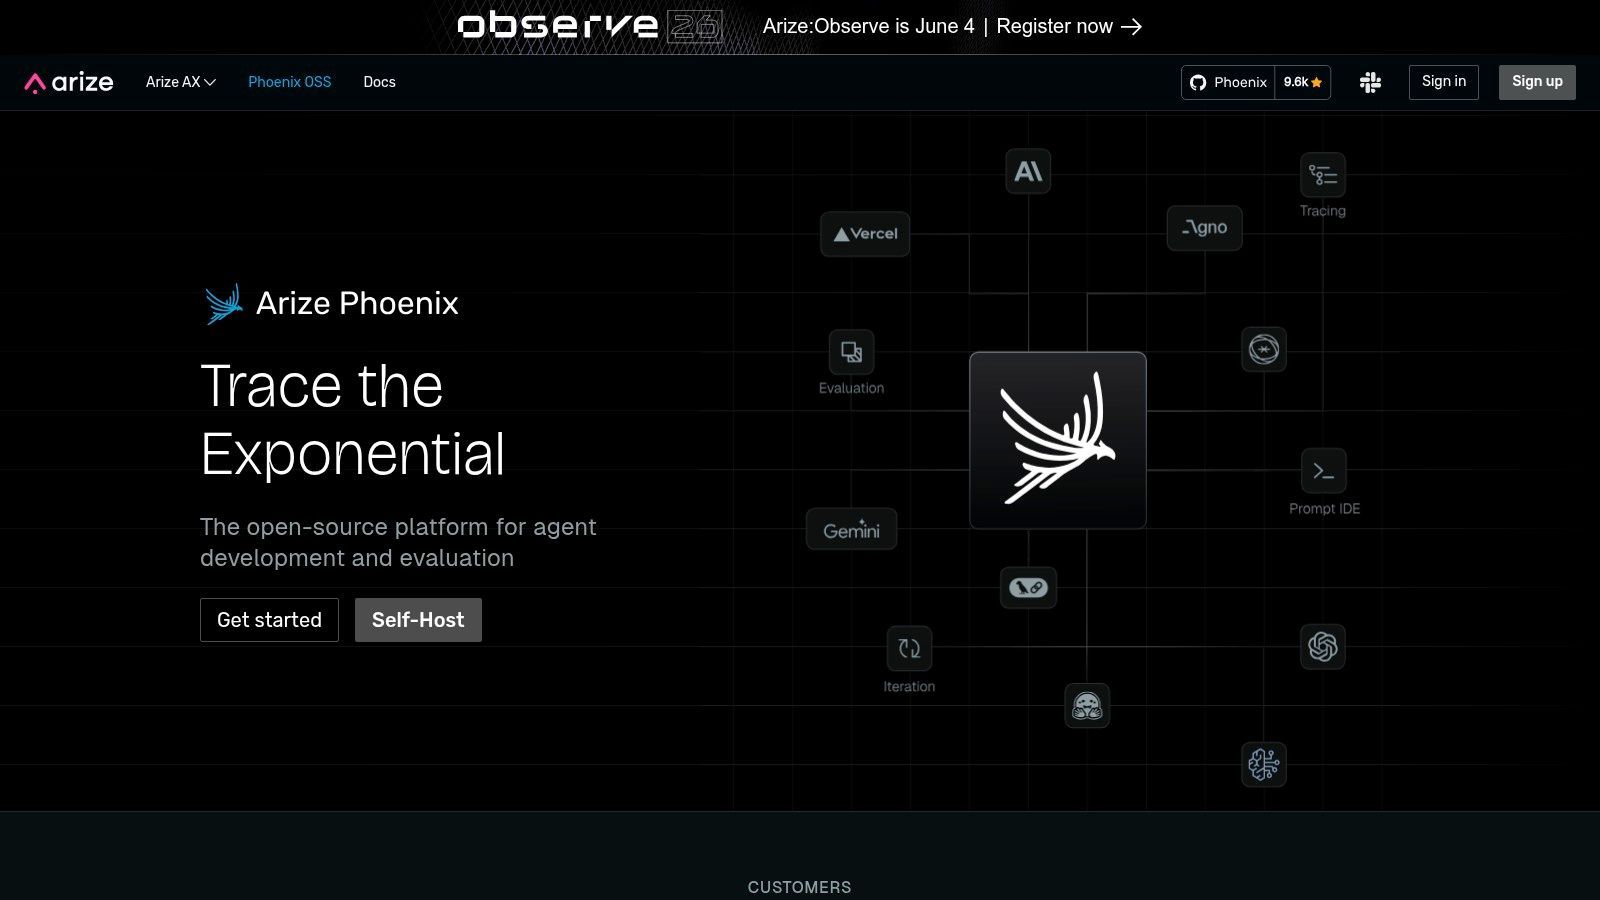
Arize Phoenix is one of the most credible open-source options in this category. If you want vendor-agnostic instrumentation, self-hosting flexibility, and trace-level visibility across RAG or agent workflows, Phoenix belongs on the shortlist immediately.
Open source first and strong on traces
Phoenix does well where many enterprise tools get awkward. It starts from open instrumentation patterns and gives teams a workable path to ingest, inspect, and evaluate AI interactions without forcing everything through a proprietary runtime. For teams that care about long-term portability, that's a real advantage.
The practical cost is setup work. Open-source freedom usually means you own more of the deployment, integration, access control, and day-two operations. Smaller teams sometimes underestimate that burden. A clean self-hosted architecture sounds great until someone has to maintain it while the product team keeps changing agent flows every week.
The broader observability tooling market has matured enough that teams now have a meaningful set of major platforms to choose from, and one key shift is toward monitoring not just pipelines but also model inputs, RAG quality, and autonomous agent behavior, according to Atlan's overview of data observability tools. Phoenix fits that shift well because trace and evaluation depth matter more once applications stop being simple prompt wrappers.
What works:
- OpenTelemetry alignment: Easier to fit into mixed stacks.
- Framework coverage: Useful integrations across popular AI tooling.
- Self-hosting option: Good for teams with stronger control requirements.
What doesn't:
- More operational work: You won't get turnkey ease out of the box.
- Enterprise workflows may expand later: Some teams eventually want hosted features layered on top.
Phoenix is for builders who want control and can handle the added complexity.
4. Weights & Biases Weave
Weights & Biases didn't come into LLM tooling as a newcomer. It came in with a lot of MLOps muscle already in place. Weave benefits from that. If your org already uses W&B for experiment tracking, registry workflows, or model lifecycle management, adding LLM tracing and evaluation there is a rational move.
Best when MLOps already runs on W B
Weave is attractive because it doesn't isolate LLM observability from the rest of the ML workflow. Prompt versions, traces, datasets, and scoring can sit near model experimentation and broader platform workflows. That makes handoffs cleaner for teams running both classical ML and LLM systems.
The trade-off is weight. Very small teams can find W&B more platform-shaped than they need. If all you want is prompt traces, cost visibility, and quick debugging, Weave may feel broader than necessary. That's not a flaw. It's just the wrong size for some use cases.
A practical advantage is consolidation. Instead of asking one team to use one product for experiments and another for LLM runtime behavior, Weave can reduce tool sprawl if your company already trusts the W&B operating model.
- Good fit: Teams already standardized on W&B and running mixed ML plus LLM workloads.
- Less ideal: Solo builders or lightweight apps that don't need the surrounding platform.
- Main risk: Platform lock-in becomes more real as more of the workflow moves into one vendor.
Weave is best understood as an extension of an MLOps system, not just one more item in the AI observability tools category.
5. Langfuse
Langfuse sits in a sweet spot that a lot of teams want. It offers open-source flexibility, production-oriented tracing, prompt management, analytics, and evaluations, but it doesn't feel as infrastructure-heavy as some self-managed stacks.
Balanced option for startups and self hosting
If I had to describe Langfuse in one line, I'd call it the practical middle ground. It gives startups enough product surface to move fast, while still giving privacy-sensitive or infrastructure-conscious teams a self-hosted path. That combination is rare. Most products skew either toward polished SaaS or flexible but rough open source.
Langfuse is especially useful for teams that know they need observability, prompt versioning, and experiment tracking together, but don't necessarily want a full unified backend. You can keep your existing inference stack and add Langfuse as the observability layer without reorganizing the whole application around a new platform.
The best thing about Langfuse is balance. The biggest drawback is that balance still requires configuration. You don't get enterprise polish automatically just because the feature list is broad.
Why teams choose it:
- OSS plus cloud flexibility: You can start one way and shift later.
- Solid production features: Traces, prompts, analytics, and evals cover the core workflow.
- Community momentum: Easier to find examples and implementation patterns than with niche tools.
Where it can bite:
- Self-hosting still costs attention: Someone has to own it.
- Support model varies: Cloud and self-hosted experiences are different operationally.
For a lot of startups, Langfuse is the tool that survives the second round of evaluation because it avoids extremes.
6. Helicone
Helicone is less of a pure observability product and more of an AI gateway with observability built in. That architectural decision changes the value proposition. Instead of instrumenting everywhere, you route requests through the gateway and get logging, analytics, caching, rate controls, and provider-aware behavior from the same layer.
Strong gateway model with real operational upside
This works well for application teams that want fast rollout and provider-agnostic visibility. A gateway can be simpler than adding SDKs across several services, especially when you're already dealing with multiple model vendors. Helicone's per-request trace data, prompt analytics, and routing features make it useful for teams that care as much about operational control as they do about debugging.
The flip side is obvious. Some companies don't want a proxy or gateway in the path. Security reviews, latency concerns, or deployment constraints can kill this model quickly. Gateway-based platforms are great when your architecture accepts them and frustrating when it doesn't.
One area where Helicone fits a real gap is cost visibility across providers. Cost observability in multi-provider AI setups is still poorly addressed, and only a minority of platforms offer unified multi-provider dashboards according to Braintrust's writeup on AI observability platforms. Helicone isn't the only product tackling that problem, but it's one of the clearer examples of why gateway architecture can help.
What stands out:
- Low-friction adoption: Good drop-in path for many app teams.
- Useful controls: Caching and routing aren't just nice extras. They change spend and reliability.
- Analytics depth: HQL-style querying helps once the basic dashboards stop being enough.
What to evaluate carefully:
- Proxy fit: Not every environment will accept it.
- Plan boundaries: Some compliance and advanced controls sit behind paid tiers.
7. Galileo
Galileo is worth considering when "observability" in your org really means "reliability." Some tools are great at showing traces but weaker at helping teams decide whether outputs are acceptable. Galileo leans harder into continuous evaluation, faithfulness, hallucination-oriented checks, and production quality monitoring.
Reliability focused rather than tracing only
That orientation matters for RAG apps and agents, where the hardest incidents are often quality failures, not infrastructure failures. A user doesn't care that your trace looks clean if the answer is wrong, ungrounded, or unsafe. Galileo is built for teams that need to monitor those higher-level failure modes in production rather than just inspecting spans.
This isn't usually the first tool I'd hand to a solo founder building a simple chatbot. It fits better in teams with a more formal AI reliability workflow, where evaluation and monitoring are ongoing disciplines instead of occasional debugging tasks.
Galileo's strengths:
- Quality-focused runtime monitoring: Better fit when answer quality is the central risk.
- Step-level debugging: Helpful for RAG and agent systems with several moving parts.
- Enterprise readiness: Built for production teams, not just prototypes.
Its costs:
- Less self-hosting flexibility: Most appeal is in the hosted experience.
- May be more than you need: If your app is simple, the reliability stack can feel heavy.
Galileo is a strong pick when the question isn't "what happened?" but "was the behavior good enough to trust?"
8. Fiddler AI
Fiddler AI comes from the enterprise monitoring and governance side, and you can feel that immediately. It isn't trying to be the lightest possible tool for prompt traces. It's trying to give regulated teams one place to monitor ML systems, LLM applications, and increasingly agentic behavior with explainability and trust controls in view.
Enterprise heavy and governance aware
That makes Fiddler a better fit for larger organizations than for scrappy app teams. If you need drift detection, root-cause analysis, safety checks, and agent-focused observability in the same platform, the product shape makes sense. If you're a two-person startup trying to debug prompt regressions, it may feel oversized.
The practical trade-off is implementation overhead. Enterprise-grade breadth usually means a longer path to value. You have to know what questions you're trying to answer before the platform pays off.
Choose Fiddler when governance and explainability are first-order requirements. Don't choose it just because the feature matrix is large.
What it does well:
- Broad coverage: Classical ML and GenAI can coexist in one monitoring system.
- Trust and safety depth: Useful where model behavior has compliance implications.
- Agent visibility: Better than platforms that stop at prompt-response logging.
What to watch:
- Sales-led process: Harder for small teams to evaluate casually.
- Heavier rollout: You'll want internal owners on the ML platform side.
Fiddler is for organizations that need observability to satisfy engineering, risk, and governance at the same time.
9. TruEra

TruEra appeals to teams that want observability tied tightly to explainability, testing, and responsible AI workflows. That's a different emphasis from products that center mostly on traces or prompt analytics.
Best for teams that care about explainability too
In practice, TruEra makes more sense when your organization already thinks in terms of model governance and quality controls across the lifecycle. Teams in that mode usually want more than runtime metrics. They want testing, collaboration, explainability, and audit-friendly workflows around those metrics.
That can be powerful, but it can also be overkill. Lightweight applications often don't need an entire responsible-AI-oriented platform just to understand prompt failures or token spend. The gap between "what's valuable" and "what's necessary" matters a lot in this category.
A good way to evaluate TruEra is to ask whether your team needs one system that spans classical ML and newer LLM workflows while maintaining governance context. If the answer is yes, it's compelling. If the answer is no, you may pay for more posture than utility.
- Strong fit: Organizations with formal review, explainability, or model governance needs.
- Weak fit: Builders who mainly need quick tracing and prompt iteration.
- Main upside: Observability sits inside a wider quality and responsibility workflow.
TruEra is less about fast debugging alone and more about monitored decision-making across the lifecycle.
10. Datadog LLM Observability
Datadog LLM Observability is the easiest recommendation on this list for one specific buyer: the company that already runs everything through Datadog. In that case, keeping AI telemetry in the same console as application performance, logs, and infrastructure signals is a real advantage.
The obvious choice for Datadog shops
The best part of Datadog's approach is correlation. When a model call slows down, errors spike, or token usage changes, you can inspect that in the same environment where you already diagnose service health and deployment issues. For established platform teams, that continuity matters more than having the most specialized LLM product.
This is also where enterprise observability economics matter. In the broader AI-based data observability software market, software platforms account for a dominant 78% revenue share as of 2025 according to Precedence Research on the AI-based data observability software market. That doesn't tell you which tool to buy, but it does explain why broad platform vendors remain so influential in production environments.
The downside is predictable:
- Pricing complexity: Span volume and retention decisions can get expensive fast.
- Best inside the ecosystem: If you aren't already a Datadog shop, the appeal drops sharply.
- Less opinionated for AI workflow changes: Great for monitoring. Less direct for prompt-management-driven iteration.
Datadog is rarely the most charming product in this space. It is often the most organizationally convenient.
Top 10 AI Observability Tools, Feature Comparison
Making the Right Choice for Your AI Stack
A team ships an LLM feature in two weeks. By week six, nobody can explain why latency doubled, why one provider swap raised costs, or which prompt version introduced the regression. That is the point where "observability tool" stops being a nice-to-have and starts becoming an architecture decision.
The choice here is less about which dashboard looks best and more about where you want operational complexity to live. This guide is not just a ranked list of tools. The fundamental decision is whether to centralize prompts, routing, tracing, and cost controls in one backend, or assemble those capabilities from several specialized products that your platform team can operate over time.
Unified Backend vs Point Solutions
A unified backend like Supagen fits teams that need to move quickly and keep the AI stack small enough to reason about. That usually means product teams shipping their first serious AI workflow, startups without a dedicated MLOps function, or companies that do not want prompt management in one system, routing in another, and tracing somewhere else. One integration point matters. One place to inspect a request, compare model behavior, review spend, and change runtime behavior matters even more.
I have seen this trade-off play out the same way repeatedly. Unified systems give up some flexibility, but they remove a lot of coordination tax. During an incident, that usually matters more than having the theoretically best tool in each category.
Point solutions make more sense when the organization already has strong standards around telemetry, security, and data handling. An enterprise team may want Datadog for application and infrastructure monitoring, Phoenix or Langfuse for open tracing and evaluation workflows, and a separate governance layer for approval, audit, or model risk review. That stack can be the right call if you need self-hosting, tighter control over storage, or the freedom to swap parts without changing the whole system.
The cost of that flexibility is integration work. Teams have to normalize trace IDs, align retention policies, maintain SDKs or gateways, and teach engineers where to look first when something breaks. If the team can support that overhead, point solutions can be a better long-term fit. If not, fragmentation shows up fast in slower debugging and fuzzy ownership.
The Ultimate Evaluation Checklist
Before choosing a tool, test it against the way your team operates.
- Integration fit: Check support for your model providers, orchestration framework, cloud environment, and deployment pattern. Mixed stacks benefit from tools that do not force a single vendor path.
- Trace fidelity: Make sure you can inspect full execution paths across chains, RAG retrieval, tool calls, and agent steps. Request logs alone stop being useful once workflows branch.
- Cost visibility: Token counts, latency, cache hits, and provider spend need to map back to prompts, routes, and user-facing features. Otherwise finance gets one view, engineering gets another, and neither is enough.
- Prompt and config control: Some teams want pure observability. Others need prompt versioning, model settings, and rollback controls tied to production traces. Pick for your workflow, not for a feature checklist.
- Evaluation support: Traces explain what happened. Evaluations tell you whether the output was good enough. For RAG, agents, and customer-facing copilots, both are required.
- Operational burden: Look closely at how instrumentation works. SDK-based tracing, proxy gateways, OpenTelemetry pipelines, and self-hosted collectors all create different maintenance costs.
- Security and governance: Review retention, redaction, access controls, auditability, and deployment options before rollout. This becomes painful to fix later.
- Modality support: If image, audio, video, or structured outputs are on the roadmap, confirm support now. Many tools handle text well and get uneven once workloads expand.
As noted earlier, adoption is rising quickly because these systems are now tied directly to revenue, support operations, and customer experience. Once AI features hit production, teams need evidence. Guessing from logs and provider invoices does not hold up for incident response or cost control.
A good selection process asks one practical question. Who will own this stack under pressure? If the answer is a small product team, a unified backend is often the safer decision. If the answer is a mature platform or MLOps group with clear standards, point solutions can deliver more control.
The best tool is the one your team will still trust during a failed rollout, a provider migration, and a budget review in the same quarter.
If you want one backend for prompts, model routing, observability, and cost tracking instead of stitching together separate tools, Supagen is a strong place to start. It's built for teams that want to ship AI features fast, inspect every call clearly, and change behavior from a dashboard without constant redeploys.