
A to Z Budget Key: An A–Z Playbook for AI Product Budgets
You've got the dashboard open, the monthly card hasn't closed yet, and one AI feature is chewing through budget faster than anyone expected. The product looked cheap in staging. In production, a prompt edit, a routing change, or a retry loop can turn a normal week into a surprise invoice, and that's exactly why the A to Z Budget Key matters for AI products.
Traditional budgeting treats spend like a monthly bucket. AI spend behaves more like a live control system. The useful question isn't just “How much did we spend?” It's “Which prompt version, model route, user cohort, or feature surface moved the number, and what do we change before the next deploy?”
That's the lens for this playbook. It maps the meters and levers that shape an AI bill, from per-call cost to fallback rules, so you can manage spend as an operational artifact instead of a mystery line item. The same discipline shows up in formal systems work, where a technical budget documents parameters, methods, values, margins, and traceability so spec drift doesn't hide in the shadows ECSS technical budget annexAnnexI_Technical-budget.docx).
Table of Contents
- Why AI Budgets Break the Old Playbook
- The Three Numbers That Run Your AI Bill
- The A to Z Glossary Grouped for Speed
- Cost Tracking From First Principles
- Your First AI Budget Template
- An Incident Runbook for Bill Shock
- Prompts, Routing, and Fallbacks as Cost Levers
- Reading a Per-Call Cost Report
- Guards to Ship Before You Scale
- Quick Reference Card
Why AI Budgets Break the Old Playbook
The invoice lands on a Tuesday, and nobody is pleased. A founder opens the bill for a single LLM feature, sees a $9,200 charge, and realizes no one caught the jump before the card cleared. That story feels harsh because the old monthly budget model assumes spend moves slowly. AI spend does not.
The sharp edge is deployment speed. One prompt rewrite can change token usage immediately. One route change can send traffic to a more expensive model. One retry policy can multiply calls without changing product behavior at all. The useful question goes deeper, which prompt version, model route, user cohort, or feature surface moved the number, and what do we change before the next deploy? The budget is not just a finance document, it is an operational map of the live paths that create cost.
Practical rule: if a deploy can change your bill, that deploy needs the same review discipline as a production incident.
The phrase A to Z Budget Key fits because the useful alphabet is not accounting theory. It is the set of levers that move the bill, units, rate inputs, guards, and rollback points. Treat them like a system, not a spreadsheet. Once a team sees it that way, monthly budgeting stops being a rearview mirror exercise and starts becoming a control loop.
For context, the U.S. federal budget process has long been tracked through standardized historical tables, and modern budget systems use those series to compare spending, receipts, deficits, and debt across years and administrations CBO budget and economic data. The lesson carries over cleanly to AI. If you do not standardize the data series behind spend, you cannot compare one version, one model, or one month to the next.
What old budget templates miss
They miss the unit-level story. A normal SaaS budget can often live with one line for cloud infrastructure and one for software. AI products need more texture. A prompt version can be expensive even when overall traffic looks stable, and a feature can look healthy in aggregate while one user cohort drives the spike.
The other gap is governance. Monthly totals do not tell you who owns a runaway route, which fallback fired, or which release changed the shape of the spend. Once those details disappear, the budget turns into a postmortem document instead of a management tool.
The Three Numbers That Run Your AI Bill
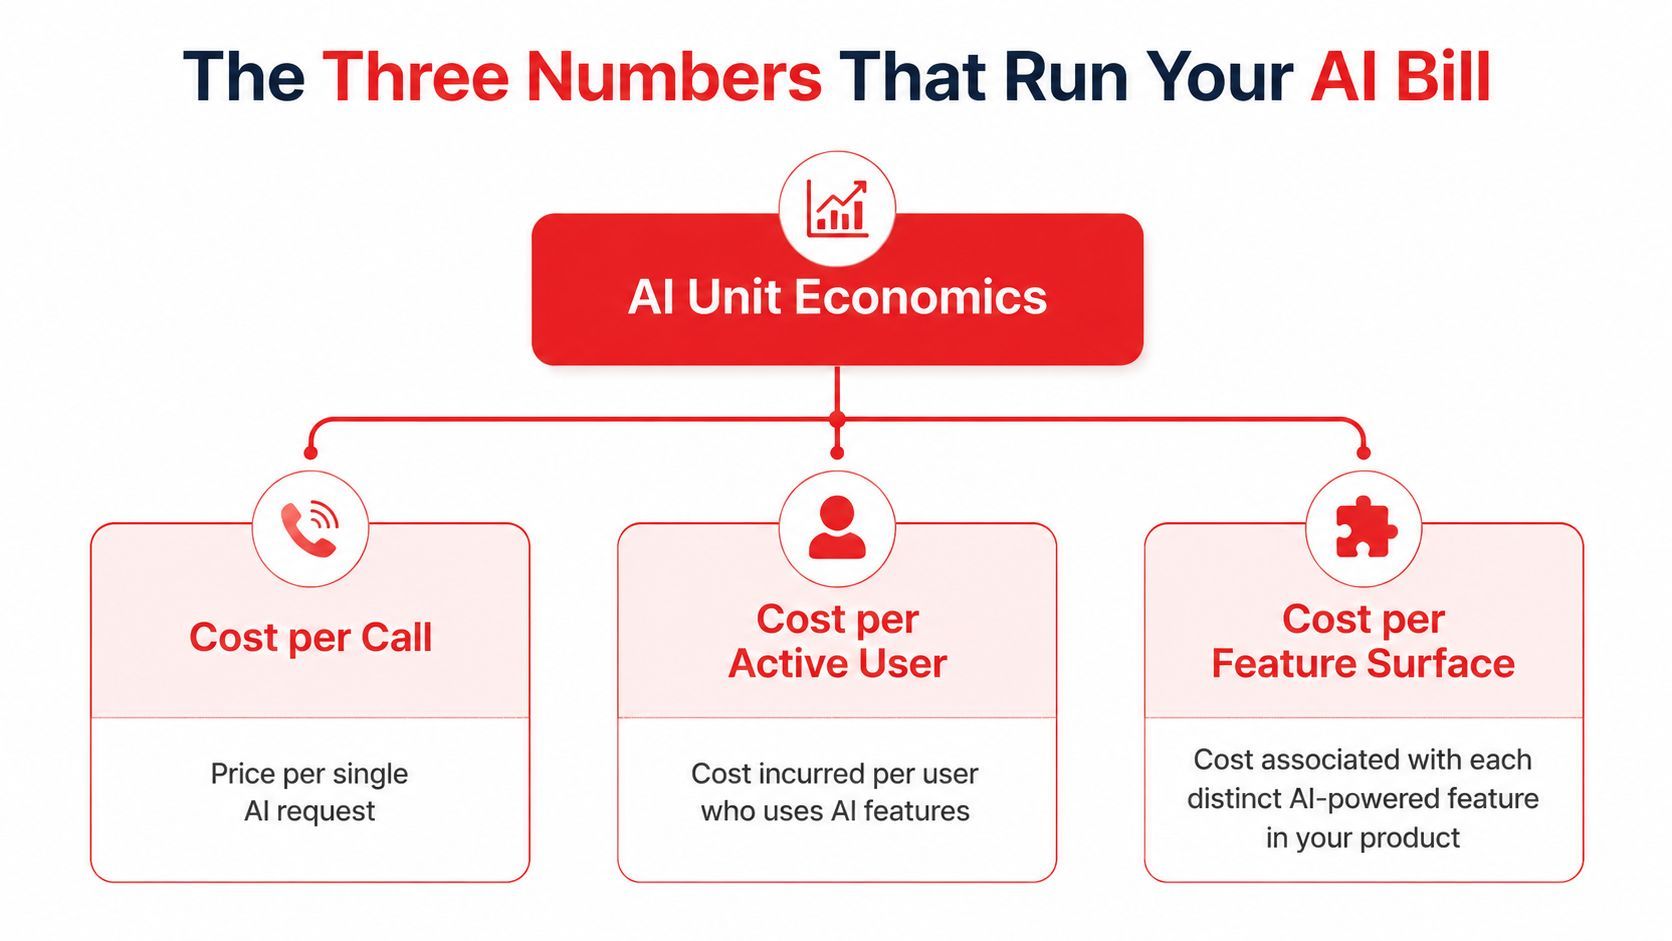
If you can't produce these three numbers, you don't yet have a usable AI budget: cost per call, cost per active user, and cost per feature surface. Each one answers a different operational question, and each one belongs on a different dashboard panel.
Cost per call
This is the cleanest unit. It's the total cost of one AI request, which you can think of as input tokens plus output tokens, multiplied by the applicable model rates. If a request uses more context, more output, or a pricier fallback model, the per-call number rises immediately.
The best practice is to compute it at the prompt version level, not just the model level. Two prompts on the same model can behave very differently. One can be concise and controlled, the other can be chatty and expensive.
Cost per active user
This is what a product manager needs for forecasting. Divide the AI spend for a period by the number of active users who touched AI features in that same period. It tells you whether adoption is healthy or whether one segment is subsidizing everyone else.
Cost per feature surface
This is the budget view often overlooked in planning. Every distinct AI feature, such as summarize, write, classify, transcribe, or agent assist, should have its own cost surface. That lets you spot the feature that eats margin while the rest of the product behaves normally.
A dashboard that only shows aggregate spend hides all of this. It can say the total is fine while one feature, one route, or one cohort is out of line. If you can't answer, in under five minutes, which feature surface is most expensive, which user cohort is most active, and which call path is most costly, you're still flying blind.
Quick self-audit: ask your team to name those three numbers for the last seven days. If one of them requires a manual spreadsheet merge, the observability stack isn't ready yet.
The A to Z Glossary Grouped for Speed
The fastest way to make the keyword useful is to group the terms by how they show up in a real system. Nobody needs 26 isolated definitions. They need the terms that appear in a usage dashboard, a budget template, and a rollback decision.
Spend units and rate inputs
Tokens are the base unit for text models. Input tokens are what you send, output tokens are what the model returns, and cached tokens matter when your provider supports reused context. These terms belong on the per-call report because they explain why one request costs more than another.
Provider list pricing is the published rate structure you use as an assumption layer in your forecast. Keep it separate from actual realized spend, because billing behavior and usage shape can vary in practice. Multimodal unit rates matter whenever you move beyond text into image, audio, or video workloads.
Governance terms and engineering artifacts
A budget cap is the ceiling, a quota is the usage limit tied to a user or feature, and a breaker is the control that stops or reroutes traffic when spend crosses a threshold. Fallbacks are the cheaper or safer path when the primary route should not continue.
Prompt versions and model versions are not paperwork. They're the objects that let you answer, later, what changed when the bill moved. Routing rules decide which model handles which request, and logs are the proof trail that lets you reconstruct the call path.
The practical split is simple. Units and rates belong in the forecast. Governance and artifacts belong in the operating rules. When those categories are mixed together, teams stop knowing whether they're looking at a price sheet, a control plane, or an incident record.
Cost Tracking From First Principles
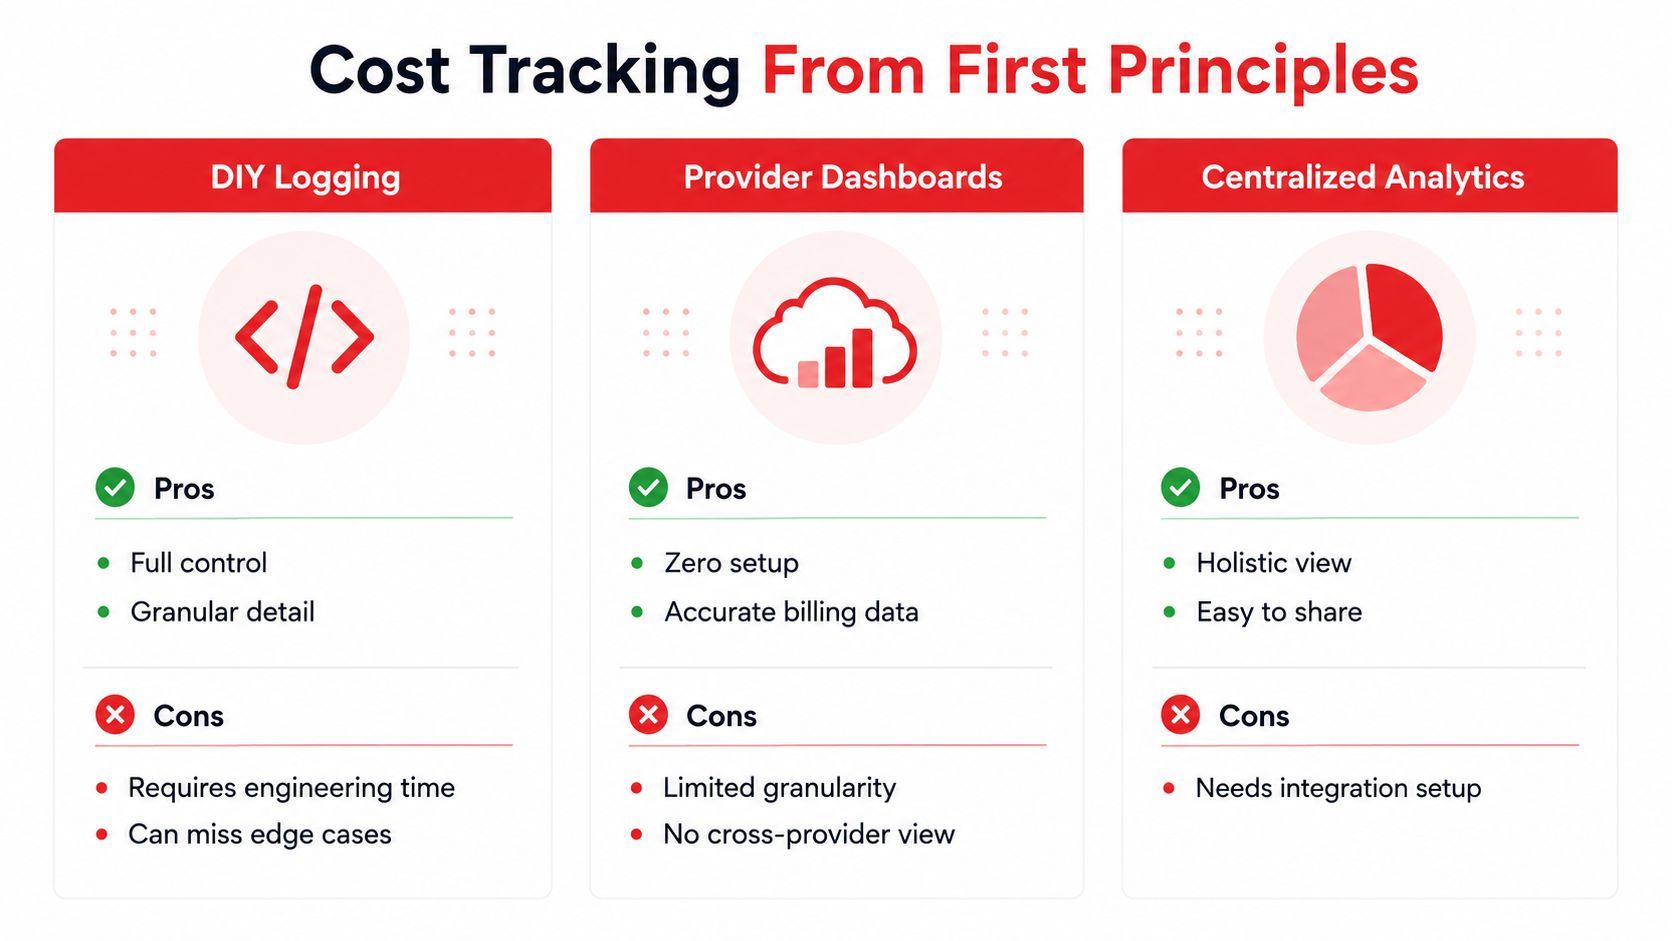
Teams start with one of three layers: their own app logs, the provider's dashboard, or a centralized analytics layer. Each one reveals something useful, and each one hides something you'll care about later.
Three ways to see the bill
DIY logging gives full control. You can record prompt version, user ID, request shape, feature name, and any other field your product needs. The downside is obvious. Engineering owns the schema, the storage, the joins, and every edge case.
Provider dashboards are the fastest way to see billing data without setup. They're good for confirming that spend is real and for checking provider-side usage details. The trade-off is granularity. You usually don't get the same cross-provider view, and you often can't trace the bill cleanly back to your own feature surfaces.
Centralized analytics sits between those two. It gives a single place to inspect tokens, latency, I/O, and costs across providers and modalities. The upside is the operational picture. The downside is the integration work you need up front.
What each layer is good for
Use DIY logging when you're still shaping the product and need maximum flexibility. Use provider dashboards when you're validating billing or reconciling a specific vendor. Use centralized analytics when you have multiple models, multiple modalities, or an audit burden that makes fragmented views expensive to live with.
The important trade-off isn't ideology, it's time. If the team spends hours every week reconciling three places just to answer one spend question, the observability stack is costing more than it saves. If the team can't explain a spike without asking engineering to pull raw logs, the dashboard isn't serving the product.
The best cost view is the one that links the request to the feature, the version, and the bill without a manual join.
Your First AI Budget Template
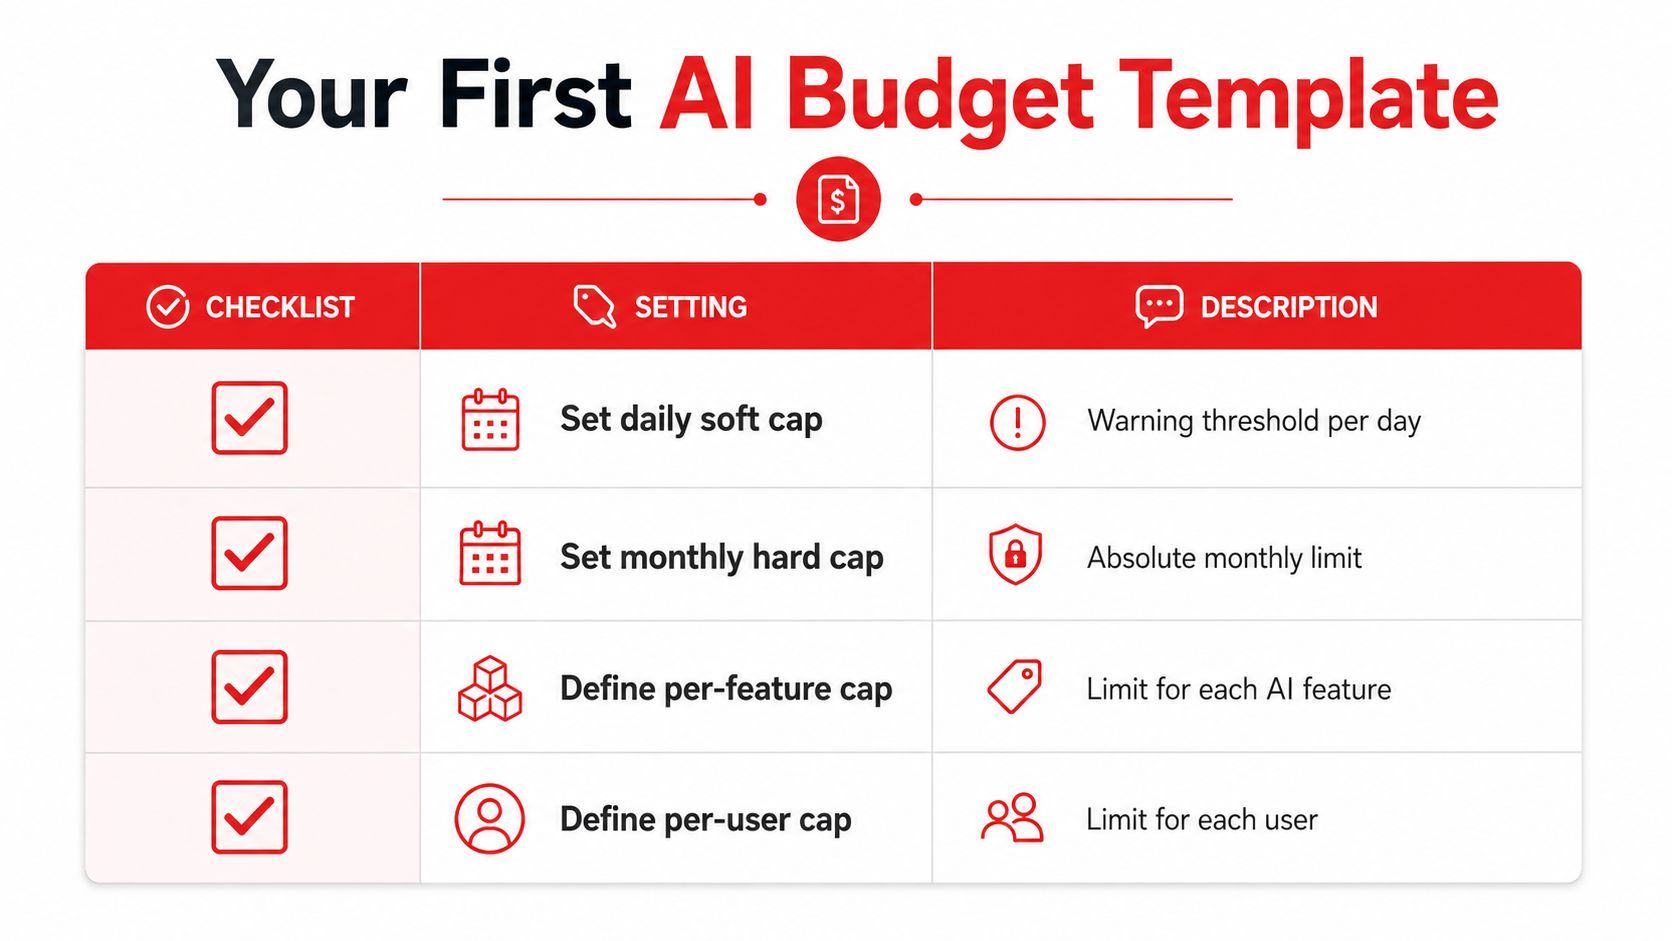
A useful template starts with controls, not totals. The row order matters because the goal is to stop surprises before they reach the card.
Build the template in layers
Start with a daily soft cap. That's the warning threshold, the point where the team gets paged or alerted, but traffic doesn't have to stop immediately. Next set the monthly hard cap, the absolute ceiling for the billing period.
Then add a per-feature cap and a per-user cap. The feature cap protects margin on high-traffic surfaces. The user cap stops one account or one workflow from becoming an accidental cost sink. Owner columns matter too, because every cap needs a human responsible for reacting when the limit is close.
For a working sheet, include these rows:
- Set daily soft cap: Warning threshold per day.
- Set monthly hard cap: Absolute monthly limit.
- Define per-feature cap: Limit for each AI feature.
- Define per-user cap: Limit for each user.
Don't forget the non-token line items
A budget that only tracks token spend is incomplete. You still need space for storage, retrieval, transcription, or other usage-based services that support the feature. If you omit them, the dashboard may look neat while the actual product economics remain messy.
A strong template also keeps alerts tied to burn behavior, not just a fixed dollar number. That way a growing feature doesn't outrun the numbers just because the old ceiling felt safe six months ago.
A practical template is boring in the best way. It tells you who owns the spend, what limit matters, and which number will trigger action before the month is already lost.
An Incident Runbook for Bill Shock
When the bill spikes, speed matters, but panic makes the bill worse. The best response is a short runbook that anyone on rotation can follow without improvising.
The five steps to use on the first alert
- Confirm the alert source. Make sure the signal came from billing, usage, or your internal monitor, not from a stale notification.
- Identify the offending prompt or model. Check the prompt version, route, and feature surface tied to the jump.
- Throttle or fall back. Use the routing layer to shift traffic, reduce volume, or switch to a cheaper path.
- Tell stakeholders in one sentence. State what changed, what's contained, and when the next update will land.
- Schedule the post-mortem while the details are fresh. Capture the exact version, route, and rollback action before memory gets fuzzy.
A sudden spike usually points to a runaway agent loop, a misconfigured retry, or a routing mistake. A slow drift usually points to a prompt that became verbose after a rewrite or a model path that was allowed to expand output. Those are different failures, and they deserve different fixes.
“Contain first, explain second” works in bill shock just as well as it does in service incidents.
Keep the runbook short enough that the on-call person can paste it into Notion, Slack, or your incident doc without editing. If the steps are longer than the urge to wing it, the runbook won't survive the first bad day.
Prompts, Routing, and Fallbacks as Cost Levers
The strongest savings usually come from engineering decisions, not finance tricks. Three of them matter most: prompt versioning, routing, and fallback design.
Versioned prompts change the unit cost
A versioned prompt lets you compare two behaviors without redeploying the whole app. If the newer prompt uses more context, asks for longer answers, or adds extra instructions, the cost per call goes up even if the model stays the same. That means prompt edits deserve the same review discipline as code changes.
Routing decides where the request goes
Smart routing sends simple requests to a cheaper model and reserves the expensive model for cases that need it. That's not just a quality decision, it's a spend decision. If a routing rule is too broad, cost creeps up. If it's too narrow, quality takes the hit.
Fallbacks protect both availability and spend
Fallback chains matter when the primary provider is slow, overloaded, or too expensive for a given request type. A clean fallback can preserve the user experience and keep the cost line from spiking because every retry stayed on the premium path. The key is making the fallback explicit and observable instead of letting the app improvise.
A single dashboard update can shift the economics without a redeploy. That's why every lever should be versioned, visible, and reversible. If a change can move spend by route selection alone, you need to treat that change like production configuration, not a casual tweak.
Reading a Per-Call Cost Report
A good per-call report should let you answer three questions quickly: what happened, what changed, and what needs attention. The fields below are the ones worth checking first.
Patterns that usually hide in plain sight
A prompt can suddenly use far more input tokens after someone adds context to “help the model.” That change is easy to miss if you only watch total spend. A route can also fail over to a more expensive provider and look normal from the user's point of view.
The report becomes useful when you compare it against the feature, not just the day. If one feature's average cost per call keeps creeping upward, the culprit is often a prompt or routing change rather than a traffic problem. That's why per-call visibility belongs next to version control.
Guards to Ship Before You Scale
Before traffic doubles, the budget needs guardrails that can stop damage. A spreadsheet can track spend, but it cannot block a runaway route or a bad prompt release.
The guards that should already be live
- Per-user quotas: Stop one customer, tenant, or workflow from becoming the entire cost problem.
- Per-feature caps: Keep a single AI surface from consuming budget meant for the rest of the product.
- Prompt-version traceability: Make it obvious which edit changed input shape, output length, or total cost.
- Model-routing rules: Send each request to the cheapest model that still handles the task.
- Fallback providers: Keep service available when the primary path is degraded or expensive.
- Alert thresholds tied to burn rate: Trigger action before the month is already lost.
- Weekly review ritual: Force a human to inspect the dashboard, compare the current route to the previous one, and approve any change that affects spend.
Each guard needs a visible home in the dashboard or the incident workflow. If the control only lives in a doc, it will not help when the app starts spending faster than expected.
A budget is only useful when it records the selected parameters, the margin policy, and the maturity of the design. That discipline belongs in AI budgets too. They need to be versioned, observable, and easy to revert when the assumptions break.
Quick Reference Card
Keep this card handy and use it on Mondays before the week gets noisy.
Core formulas
- Cost per call: input tokens plus output tokens, multiplied by the applicable rates.
- Cost per active user: AI spend for the period divided by active users who used AI features.
- Cost per feature surface: total spend for a feature divided by the number of calls or users tied to that feature.
Operating thresholds
- Daily soft cap: warn the team and inspect the route.
- Monthly hard cap: stop or constrain traffic before the bill exceeds plan.
- Per-feature cap: protect the feature margin.
- Per-user cap: stop one user from turning into a runaway cost center.
Runbook questions
- Which prompt version is most expensive?
- Which model route is leaking?
- Which feature is over budget?
- Which fallback fired?
When a new vendor invoice lands, come back to the glossary and check the terms against the actual dashboard fields. That habit turns the A to Z Budget Key from a search phrase into a working operating system.
If you're shipping AI features and want the budget to stay versioned, observable, and easy to reverse, Supagen gives you the control plane to do that without hardcoding prompts, routing logic, or cost visibility into your app. It centralizes per-call logs, prompt management, model routing, and fallbacks so you can trace spend back to the exact change that moved it.